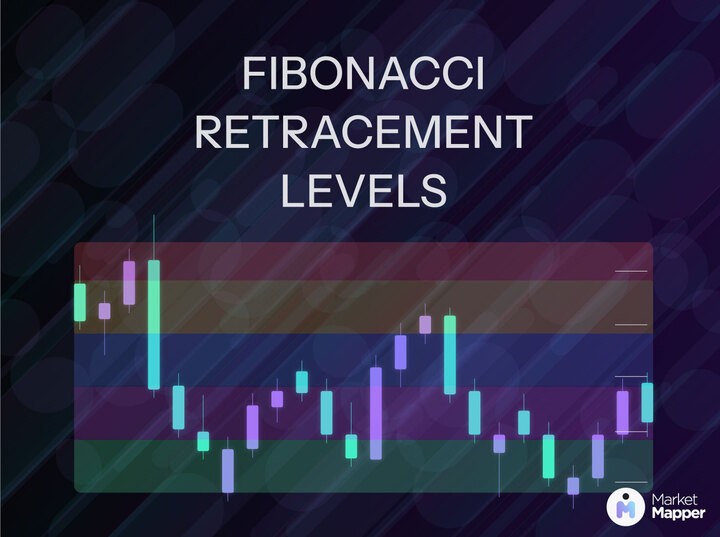
Art of Fibonacci: Retracements and Its Inner Workings
Sep 6, 2023
Fibonacci. It must definitely ring a bell of the mathematics class you had way back in 4th grade. Indeed in this post we will be exploring about Fibonacci but in trading! Do note that Fibonacci retracements are heavily tied to Elliott wave analysis which will be explained in more detail in an upcoming post.
Mathematical Foundation
The Fibonacci number sequence is 1, 1, 2, 3, 5, 8, 13, 21, 34, 55, 89, 144, and so on to infinity. Now you may be asking how is this is all tied up with trading? The answer is due to ratios found within the sequence that is utilized and seen in Fibonacci retracements.
Mechanisms:
• Pattern of Sequence: The pattern is rather simple with it being the sum of any two consecutive numbers equals the next highest number. Such as 2 and 3 equals 5, 21 and 34 equals 55, etc.
With S base n representing a term in a sequence is the sum of the two previous terms (S base n - 1 and S base n - 2).
• Ratio: We find that after four numbers within the sequence, the ratio between any number (S base n) to its next higher number (S base n + 1) is about 0.618.
What Do Ratios Indicate?
In theory, preceding ratios help to determine price objectives in both impulse and corrective waves (from the Elliott Wave Theory). The ratios directly apply to percentage retracements. So 61.8% (can be rounded to 62%), 38%, and 50% are percentages most often used in retracement analysis. We get 62% from the ratio of any number in the sequence to the next larger number. 38% is calculated from the inverse of 62%.
Retracements
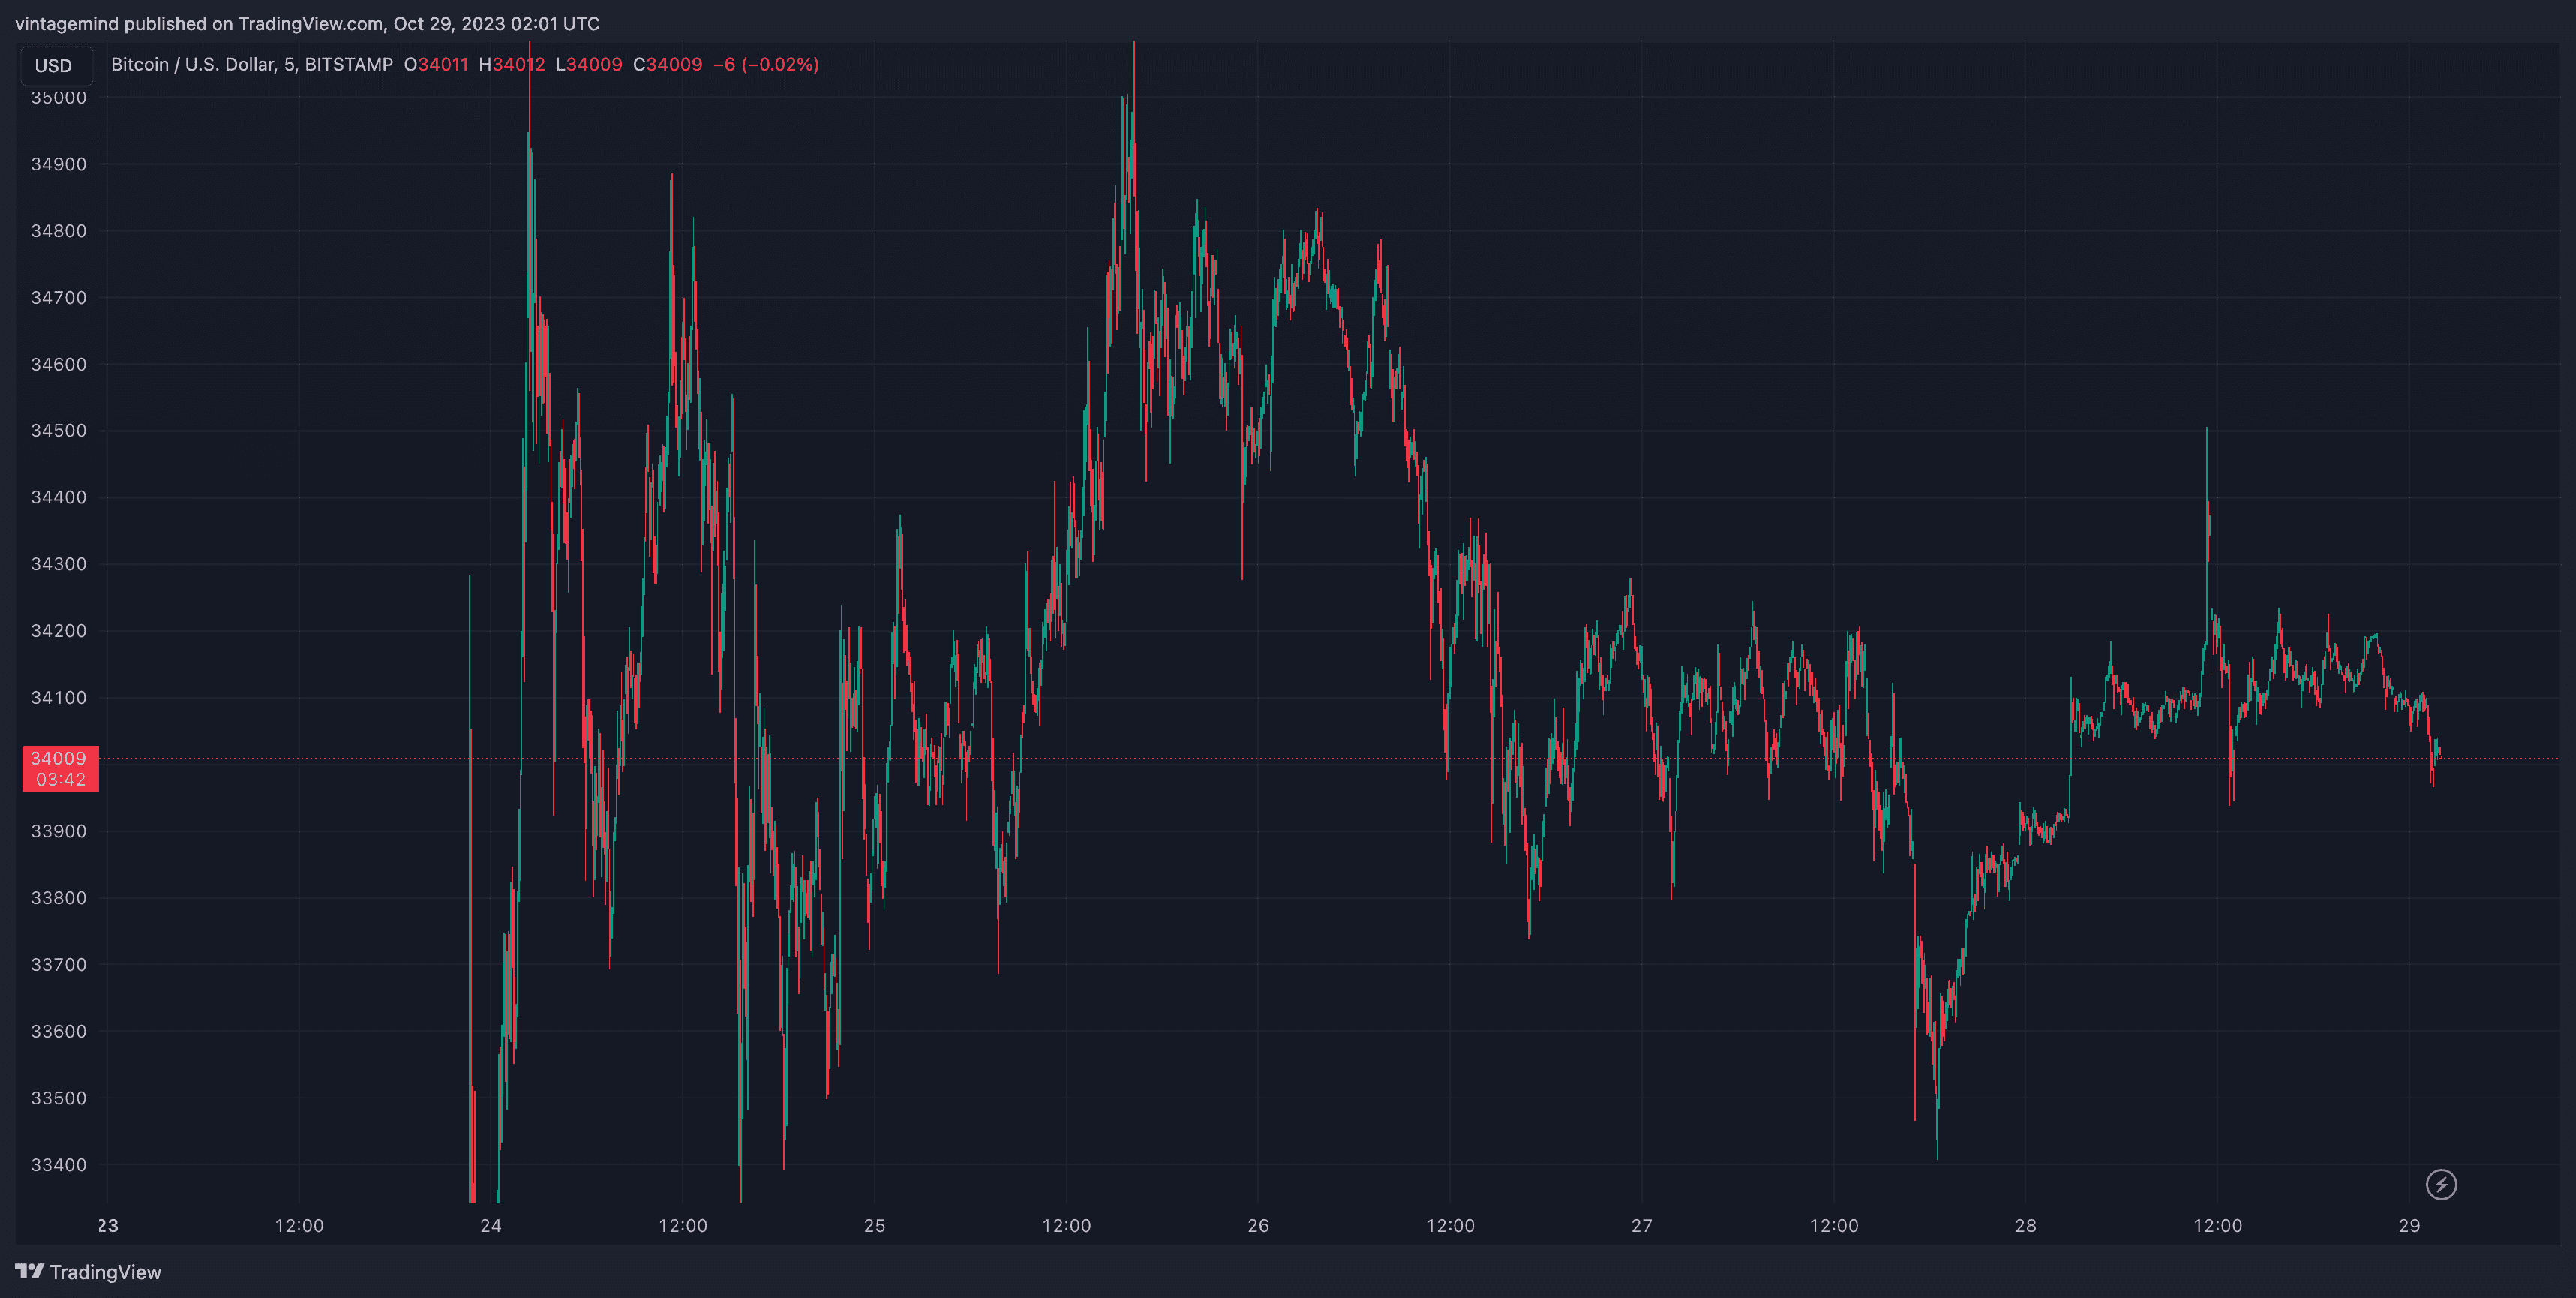
Prices "retrace" the prior trend by a percentage amount before resuming the original trend. A very well known retracement is the 50% retracement. The minimum retracement is normally 1/3 of the price while the maximum is 2/3 of the price.
Here are some things to keep in mind while trading.
In a strong trend, a minimum retracement is usually around 38%.
In a weaker trend, the maximum retracement is usually around 62%.
A complete retracement which will be 100%, should mark as an important support or resistance area.
Time Frames/Targets
In terms of time, we are technically observing any relationship between Fibonacci time targets (usually measured in months) to important turn in prices. For day trading however, you will be wanting to observe the number of trading days from an important turning point with the expectation for the future tops or bottoms to occur on Fibonacci days. This can be implemented on any timeframe.
Conclusion
Never underestimate mathematics as from a technical standpoint, many factors primarily or even solely rely on numbers. The Fibonacci retracement indicator will help you pick up different wave forms more quickly and most importantly, determine prixe objectives. Happy and safe trading!
Art of Fibonacci: Retracements and Its Inner Workings
Sep 6, 2023
Fibonacci. It must definitely ring a bell of the mathematics class you had way back in 4th grade. Indeed in this post we will be exploring about Fibonacci but in trading! Do note that Fibonacci retracements are heavily tied to Elliott wave analysis which will be explained in more detail in an upcoming post.
Mathematical Foundation
The Fibonacci number sequence is 1, 1, 2, 3, 5, 8, 13, 21, 34, 55, 89, 144, and so on to infinity. Now you may be asking how is this is all tied up with trading? The answer is due to ratios found within the sequence that is utilized and seen in Fibonacci retracements.
Mechanisms:
• Pattern of Sequence: The pattern is rather simple with it being the sum of any two consecutive numbers equals the next highest number. Such as 2 and 3 equals 5, 21 and 34 equals 55, etc.
With S base n representing a term in a sequence is the sum of the two previous terms (S base n - 1 and S base n - 2).
• Ratio: We find that after four numbers within the sequence, the ratio between any number (S base n) to its next higher number (S base n + 1) is about 0.618.
What Do Ratios Indicate?
In theory, preceding ratios help to determine price objectives in both impulse and corrective waves (from the Elliott Wave Theory). The ratios directly apply to percentage retracements. So 61.8% (can be rounded to 62%), 38%, and 50% are percentages most often used in retracement analysis. We get 62% from the ratio of any number in the sequence to the next larger number. 38% is calculated from the inverse of 62%.
Retracements
Prices "retrace" the prior trend by a percentage amount before resuming the original trend. A very well known retracement is the 50% retracement. The minimum retracement is normally 1/3 of the price while the maximum is 2/3 of the price.
Here are some things to keep in mind while trading.
In a strong trend, a minimum retracement is usually around 38%.
In a weaker trend, the maximum retracement is usually around 62%.
A complete retracement which will be 100%, should mark as an important support or resistance area.
Time Frames/Targets
In terms of time, we are technically observing any relationship between Fibonacci time targets (usually measured in months) to important turn in prices. For day trading however, you will be wanting to observe the number of trading days from an important turning point with the expectation for the future tops or bottoms to occur on Fibonacci days. This can be implemented on any timeframe.
Conclusion
Never underestimate mathematics as from a technical standpoint, many factors primarily or even solely rely on numbers. The Fibonacci retracement indicator will help you pick up different wave forms more quickly and most importantly, determine prixe objectives. Happy and safe trading!
Supercharge your trading game with Market Mapper today!