Bollinger Bands: What Are They and How to Use Them
Sep 19, 2023
Bollinger Bands is a technique which was developed and named after John Bollinger. In an overview, a trader would ultimately use Bollinger Bands to detect buy/sell signals as well quickly spot overbought or oversold signals.
How to Read Bollinger Band
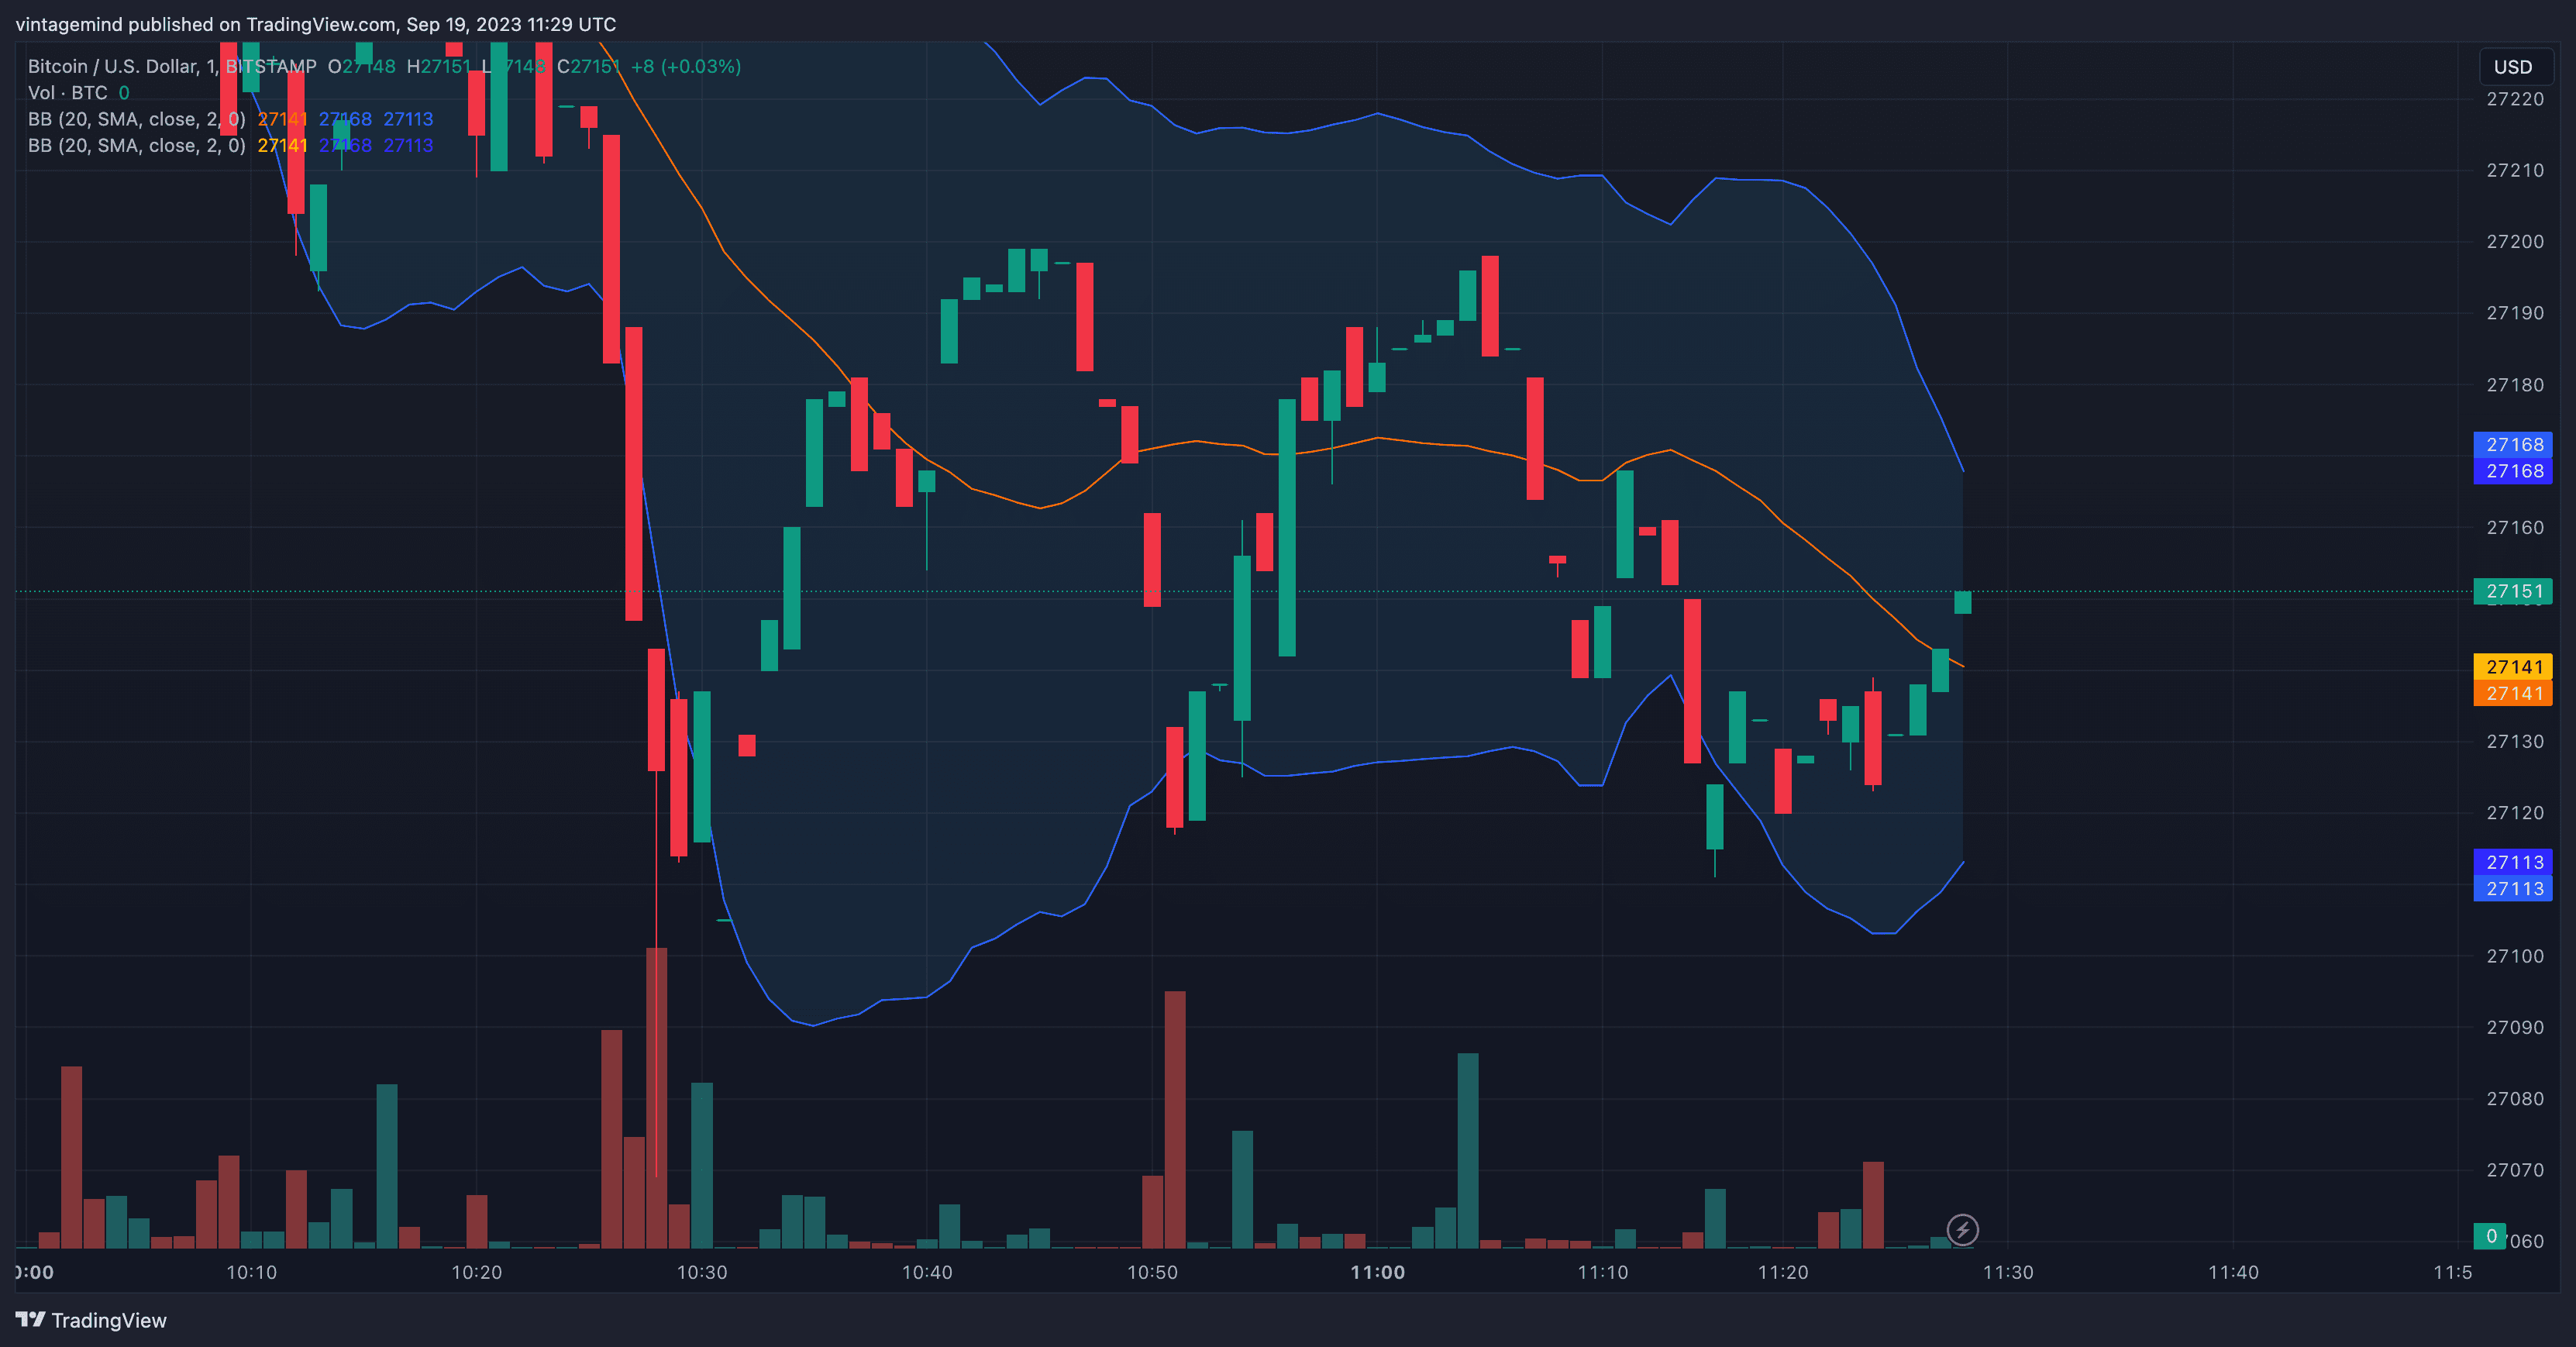
As we can see in the above chart, the orange line represents the 20 day average while the upper and lower bands are very distinguishable. The lower band is the lower blue line and the upper band is the upper blue line.
How to Interpret Bollinger Bands
The Bollinger Bands are often used as price targets. For instance, the upper bands become the upper price target and the lower bands become the lower price target. Typically, the crossing above or below the 20 day average is an ideal environment for observations.
Some things to keep in mind while using Bollinger Bands as price targets:
A crossing below the 20 day average would result in the lower bands as the downside target.
When there is a relatively strong uptrend, prices range between the 20 day average and the upper band.
When there is a relatively strong downtrend, prices range between the 20 day average and the lower band. This warns us of a possible trend reversal.
Another common use of Bollinger Bands is to measure volatility or standard deviation (how far you’re away from the 20 days SMA). Bollinger Bands do not stay a constant percentage width apart (unlike envelopes). There are two behaviors that can be observed with Bollinger Bands: expansion and contraction. This is based on the last 20 days' volatility.
In expansion, the distance between the upper and lower bands widen. This indicates there is rising price volatility.
In contraction, the distance between the upper and lower bands narrows. This indicates there is a low market volatility.
Conclusion
Bollinger Bands are highly practical and work best in unison with the RSI indicator and other overbought/oversold oscillators such as the stochastic oscillator. Do note that we need not just use the 20 day average but 20 weeks and 20 months. This is so that we can apply Bollinger Bands to longer time frames. Happy and safe trading!
Bollinger Bands: What Are They and How to Use Them
Sep 19, 2023
Bollinger Bands is a technique which was developed and named after John Bollinger. In an overview, a trader would ultimately use Bollinger Bands to detect buy/sell signals as well quickly spot overbought or oversold signals.
How to Read Bollinger Band
As we can see in the above chart, the orange line represents the 20 day average while the upper and lower bands are very distinguishable. The lower band is the lower blue line and the upper band is the upper blue line.
How to Interpret Bollinger Bands
The Bollinger Bands are often used as price targets. For instance, the upper bands become the upper price target and the lower bands become the lower price target. Typically, the crossing above or below the 20 day average is an ideal environment for observations.
Some things to keep in mind while using Bollinger Bands as price targets:
A crossing below the 20 day average would result in the lower bands as the downside target.
When there is a relatively strong uptrend, prices range between the 20 day average and the upper band.
When there is a relatively strong downtrend, prices range between the 20 day average and the lower band. This warns us of a possible trend reversal.
Another common use of Bollinger Bands is to measure volatility or standard deviation (how far you’re away from the 20 days SMA). Bollinger Bands do not stay a constant percentage width apart (unlike envelopes). There are two behaviors that can be observed with Bollinger Bands: expansion and contraction. This is based on the last 20 days' volatility.
In expansion, the distance between the upper and lower bands widen. This indicates there is rising price volatility.
In contraction, the distance between the upper and lower bands narrows. This indicates there is a low market volatility.
Conclusion
Bollinger Bands are highly practical and work best in unison with the RSI indicator and other overbought/oversold oscillators such as the stochastic oscillator. Do note that we need not just use the 20 day average but 20 weeks and 20 months. This is so that we can apply Bollinger Bands to longer time frames. Happy and safe trading!
Supercharge your trading game with Market Mapper today!