Point and Figure Charts: The Bare-Bones
Sep 20, 2023
During your time trading, you must have definitely come across point and figure charting. Point and figure charting is a very classic charting technique with it being the first one used in the modern world since 1886. Kudos to Doji for being one of the most oldest techniques.
Characteristics of Point and Figure
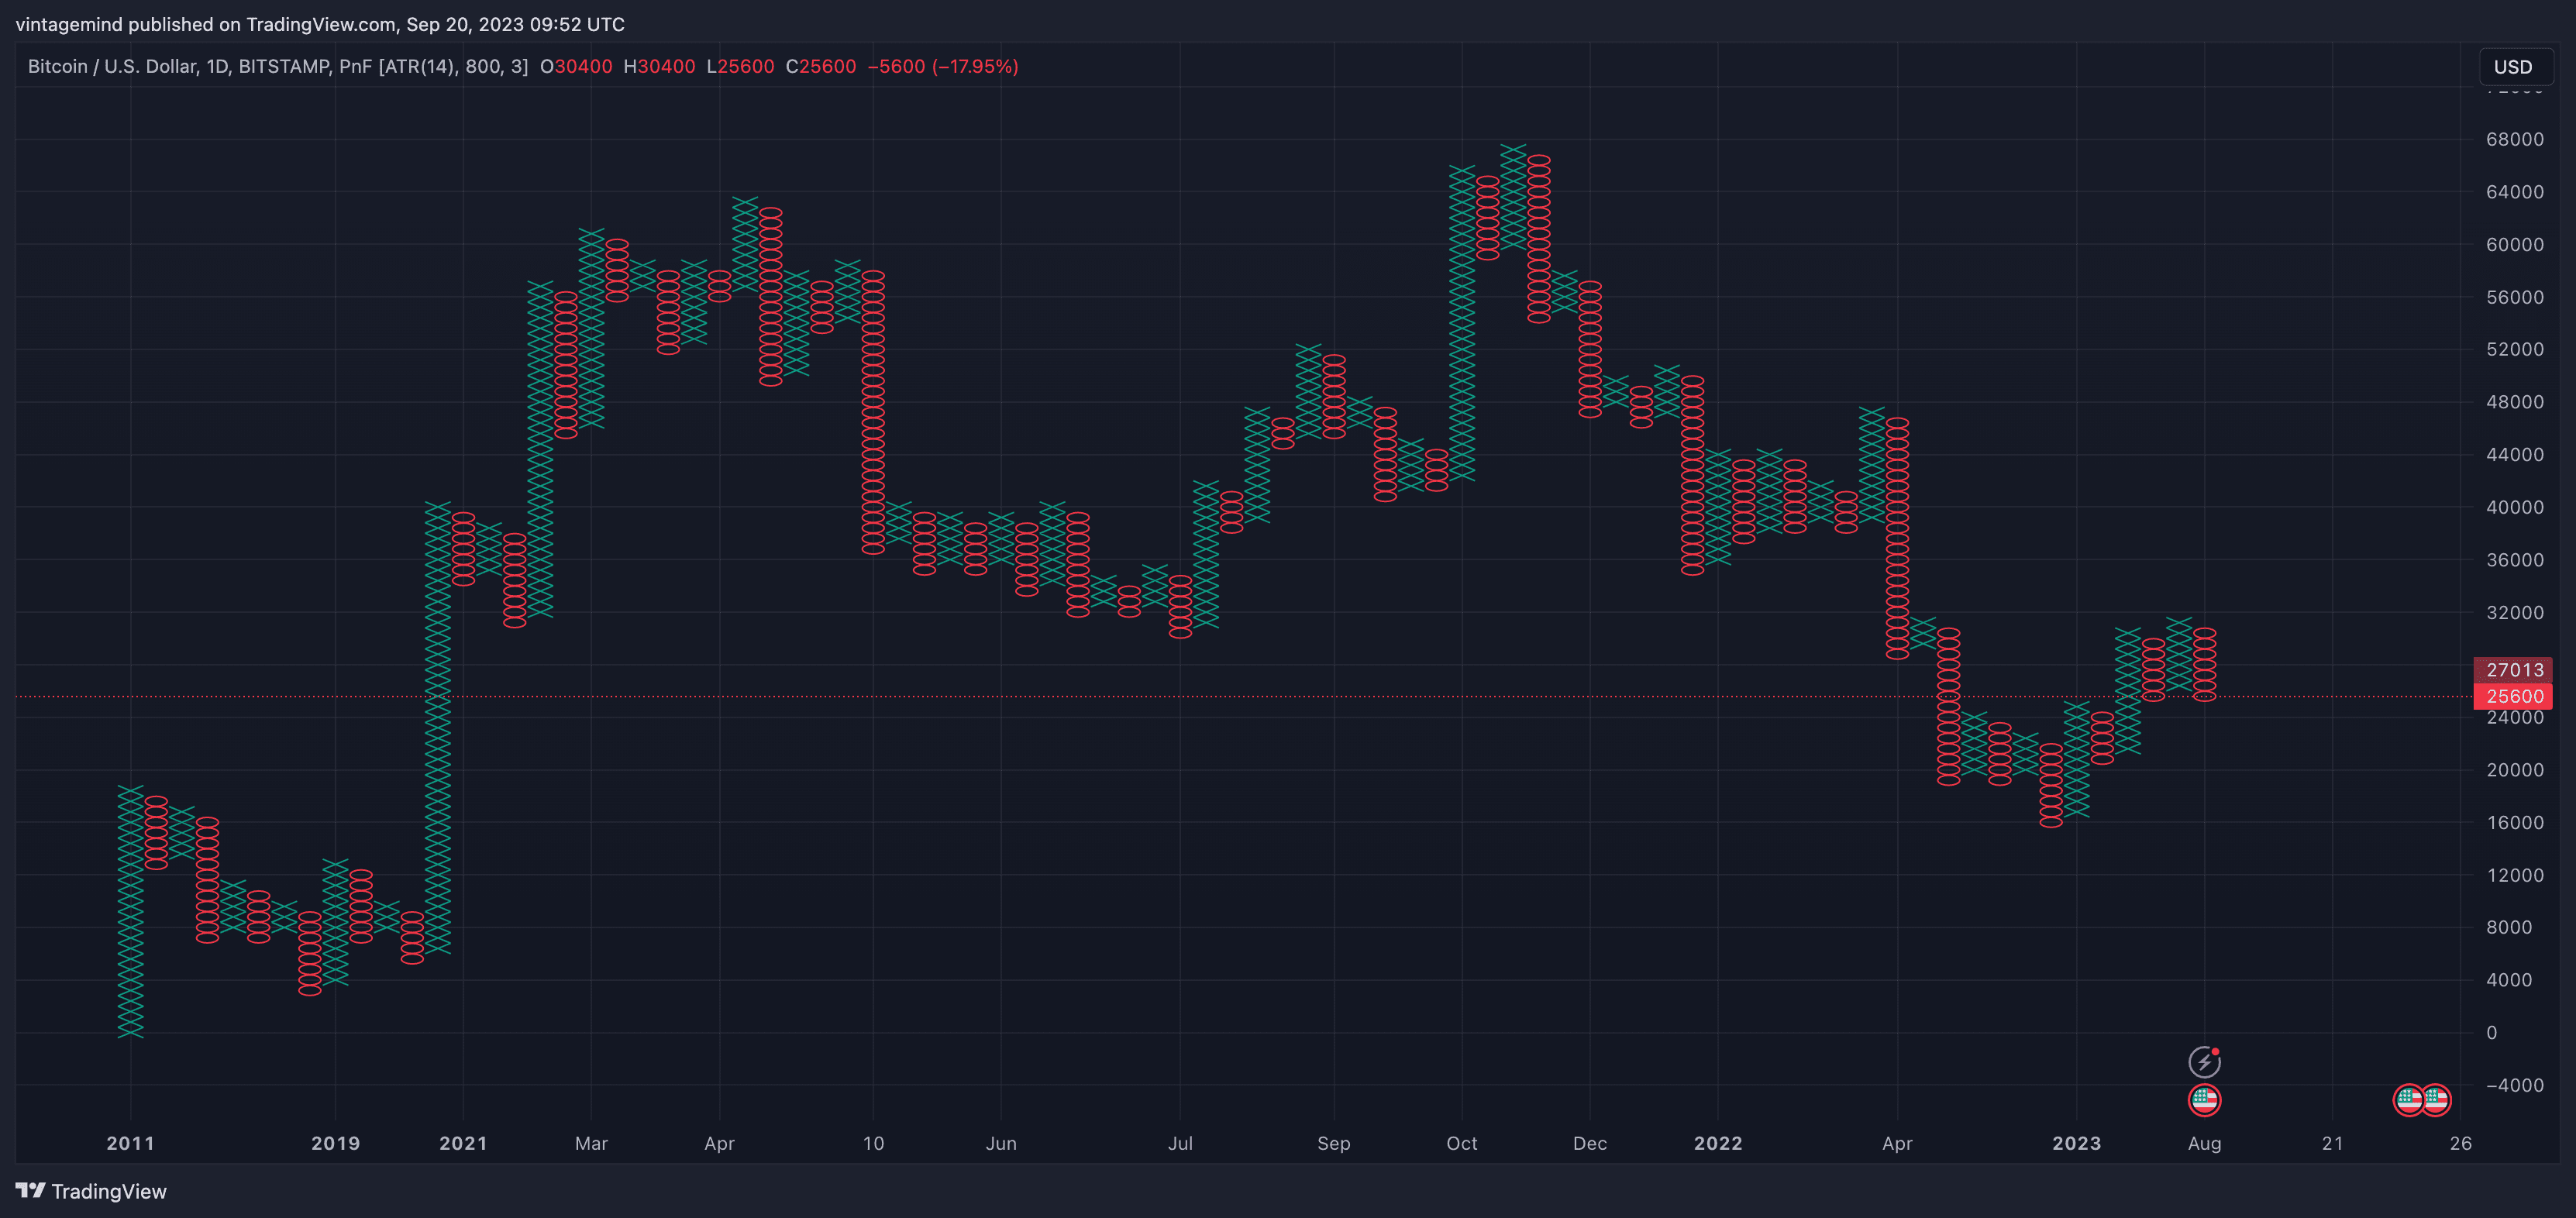
Above is a point and figure chart showcasing all-time data.
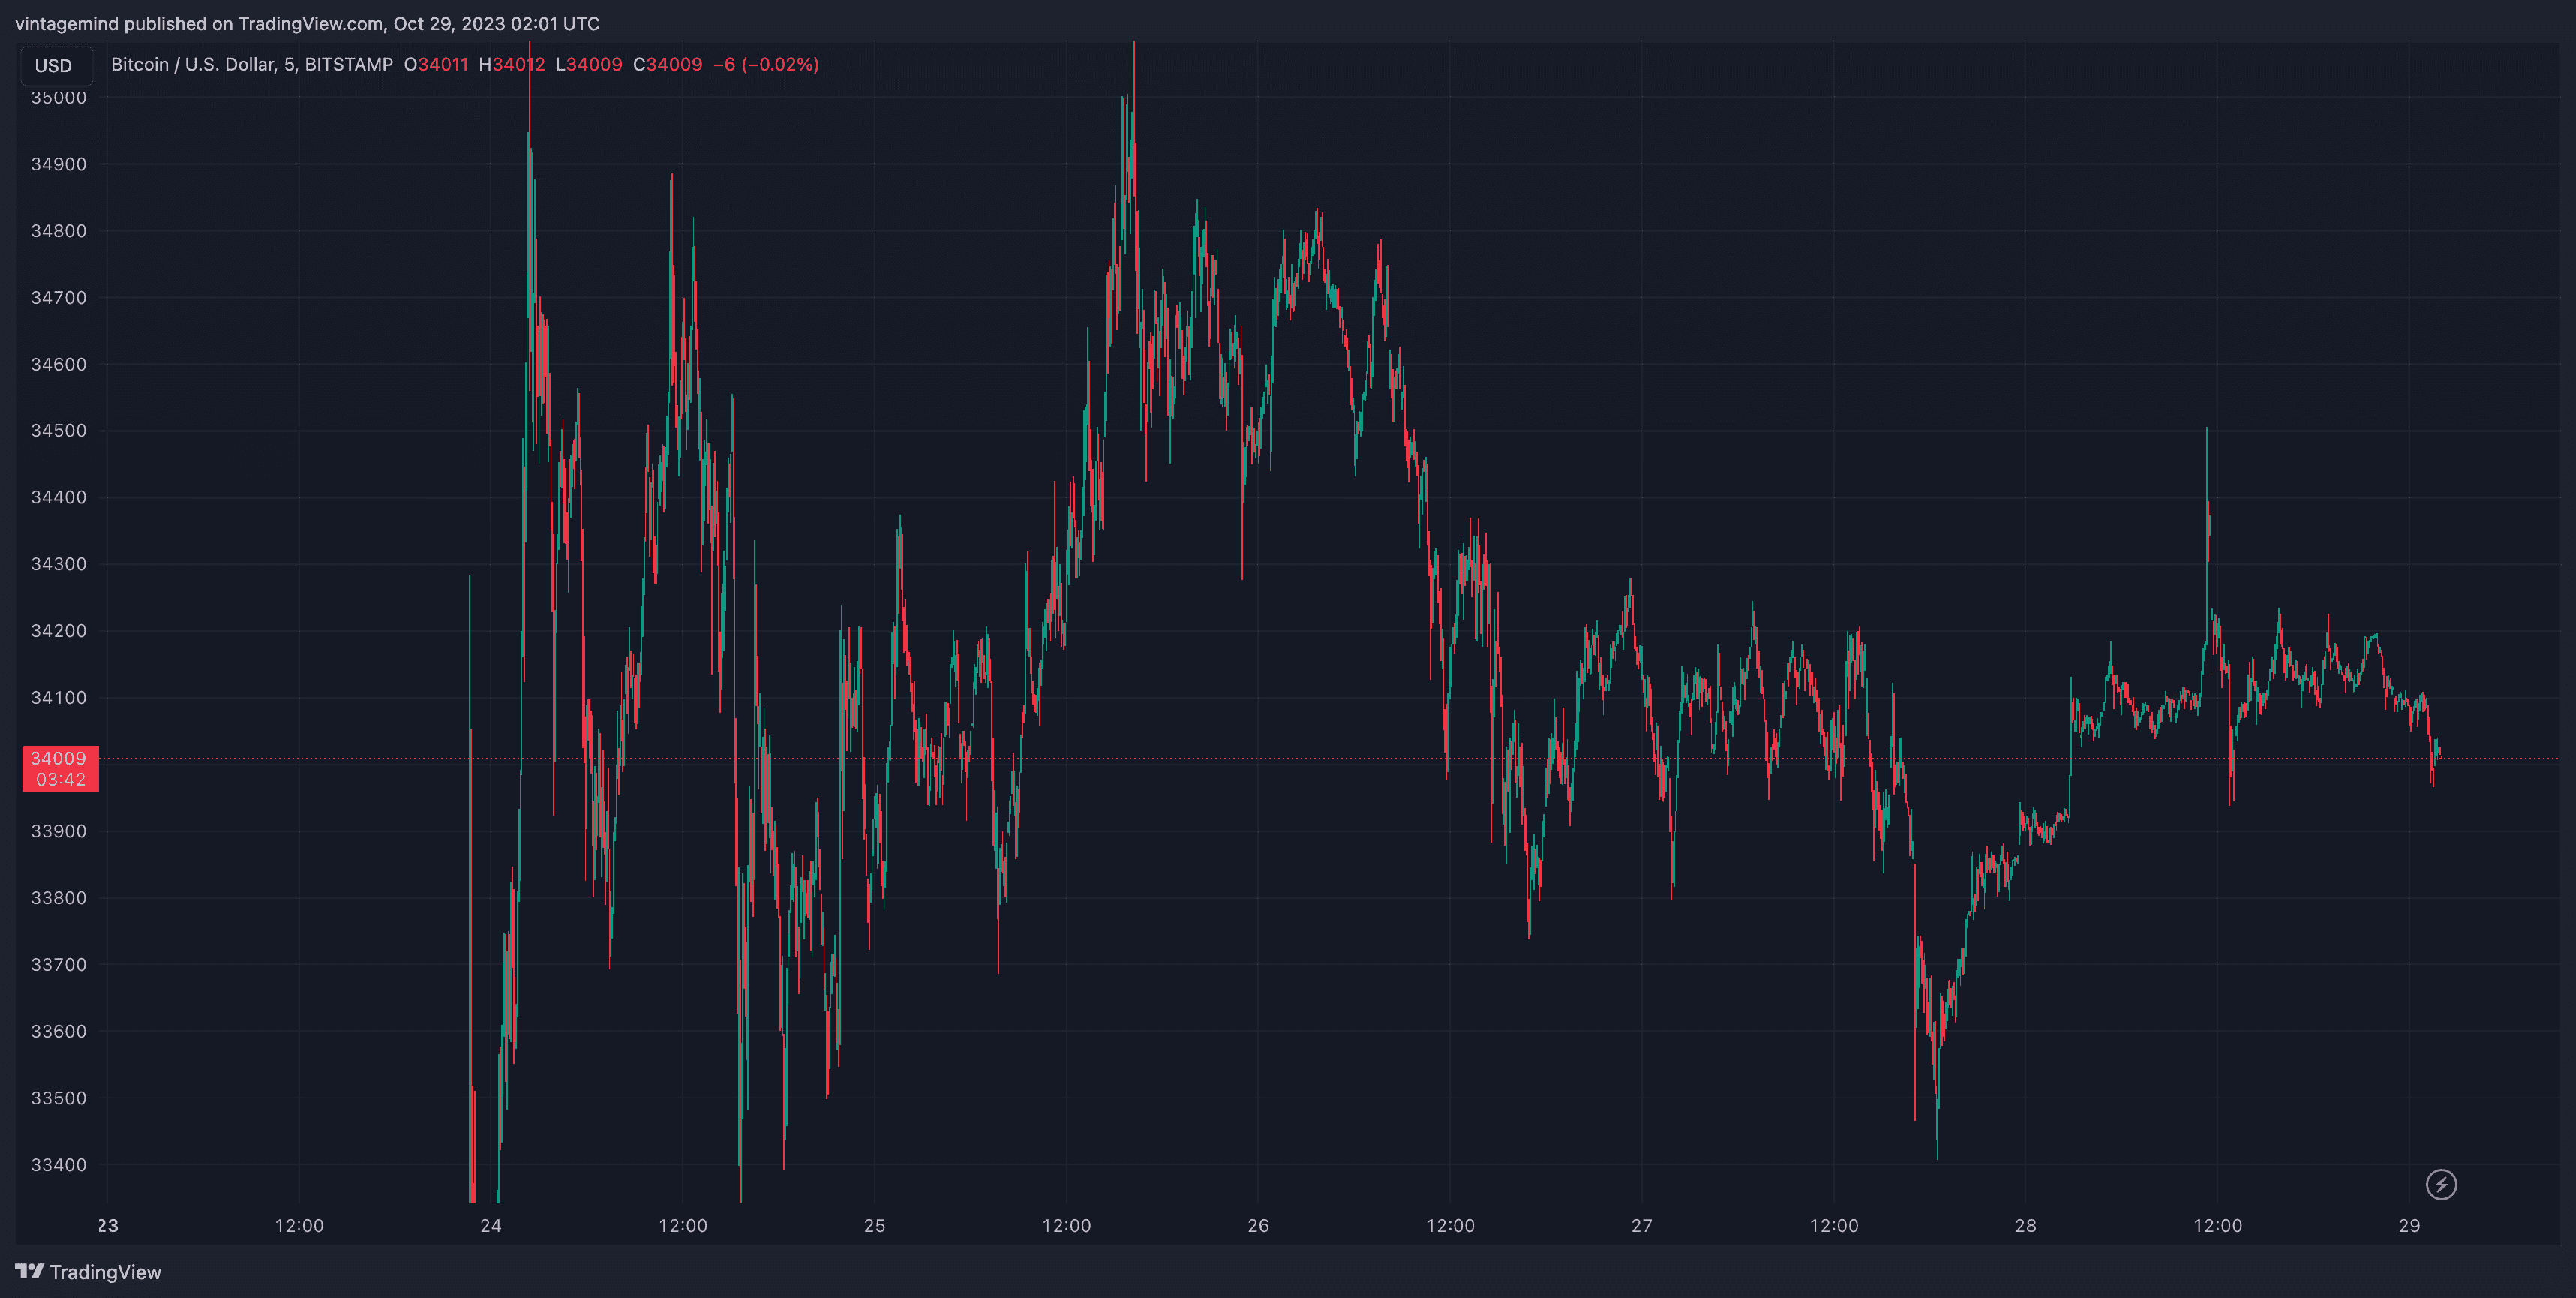
Below is the usual candle bar chart you most of the time view covering the same time span.


At closer inspection of the point and figure chart, you will notice the columns consist of either are x's or o's . Here x columns represent rising prices while o columns represent declining prices. Only price changes are recorded. This is why the point and figure chart looks so different. If there is no price change, there will be no changes on the chart.
Uses and Implementation
Point and figure charts are used for a variety of purposes but primary for tracking market movement. It is in fact a study of pure price movement.
Some things to keep in mind:
When a column of rising prices is one box higher than the highest rising price of the prior column, it indicates a buy signal.
When a column of declining prices is one box below the lowest declining price of the prior column, it indicates a sell signal.
If the most recent signal was a sell-short signal, the position is bearish and remains bearish until a buy signal occurs.
If the most recent signal was a buy signal, the position is bullish and remains bullish until a sell-short signal occurs.
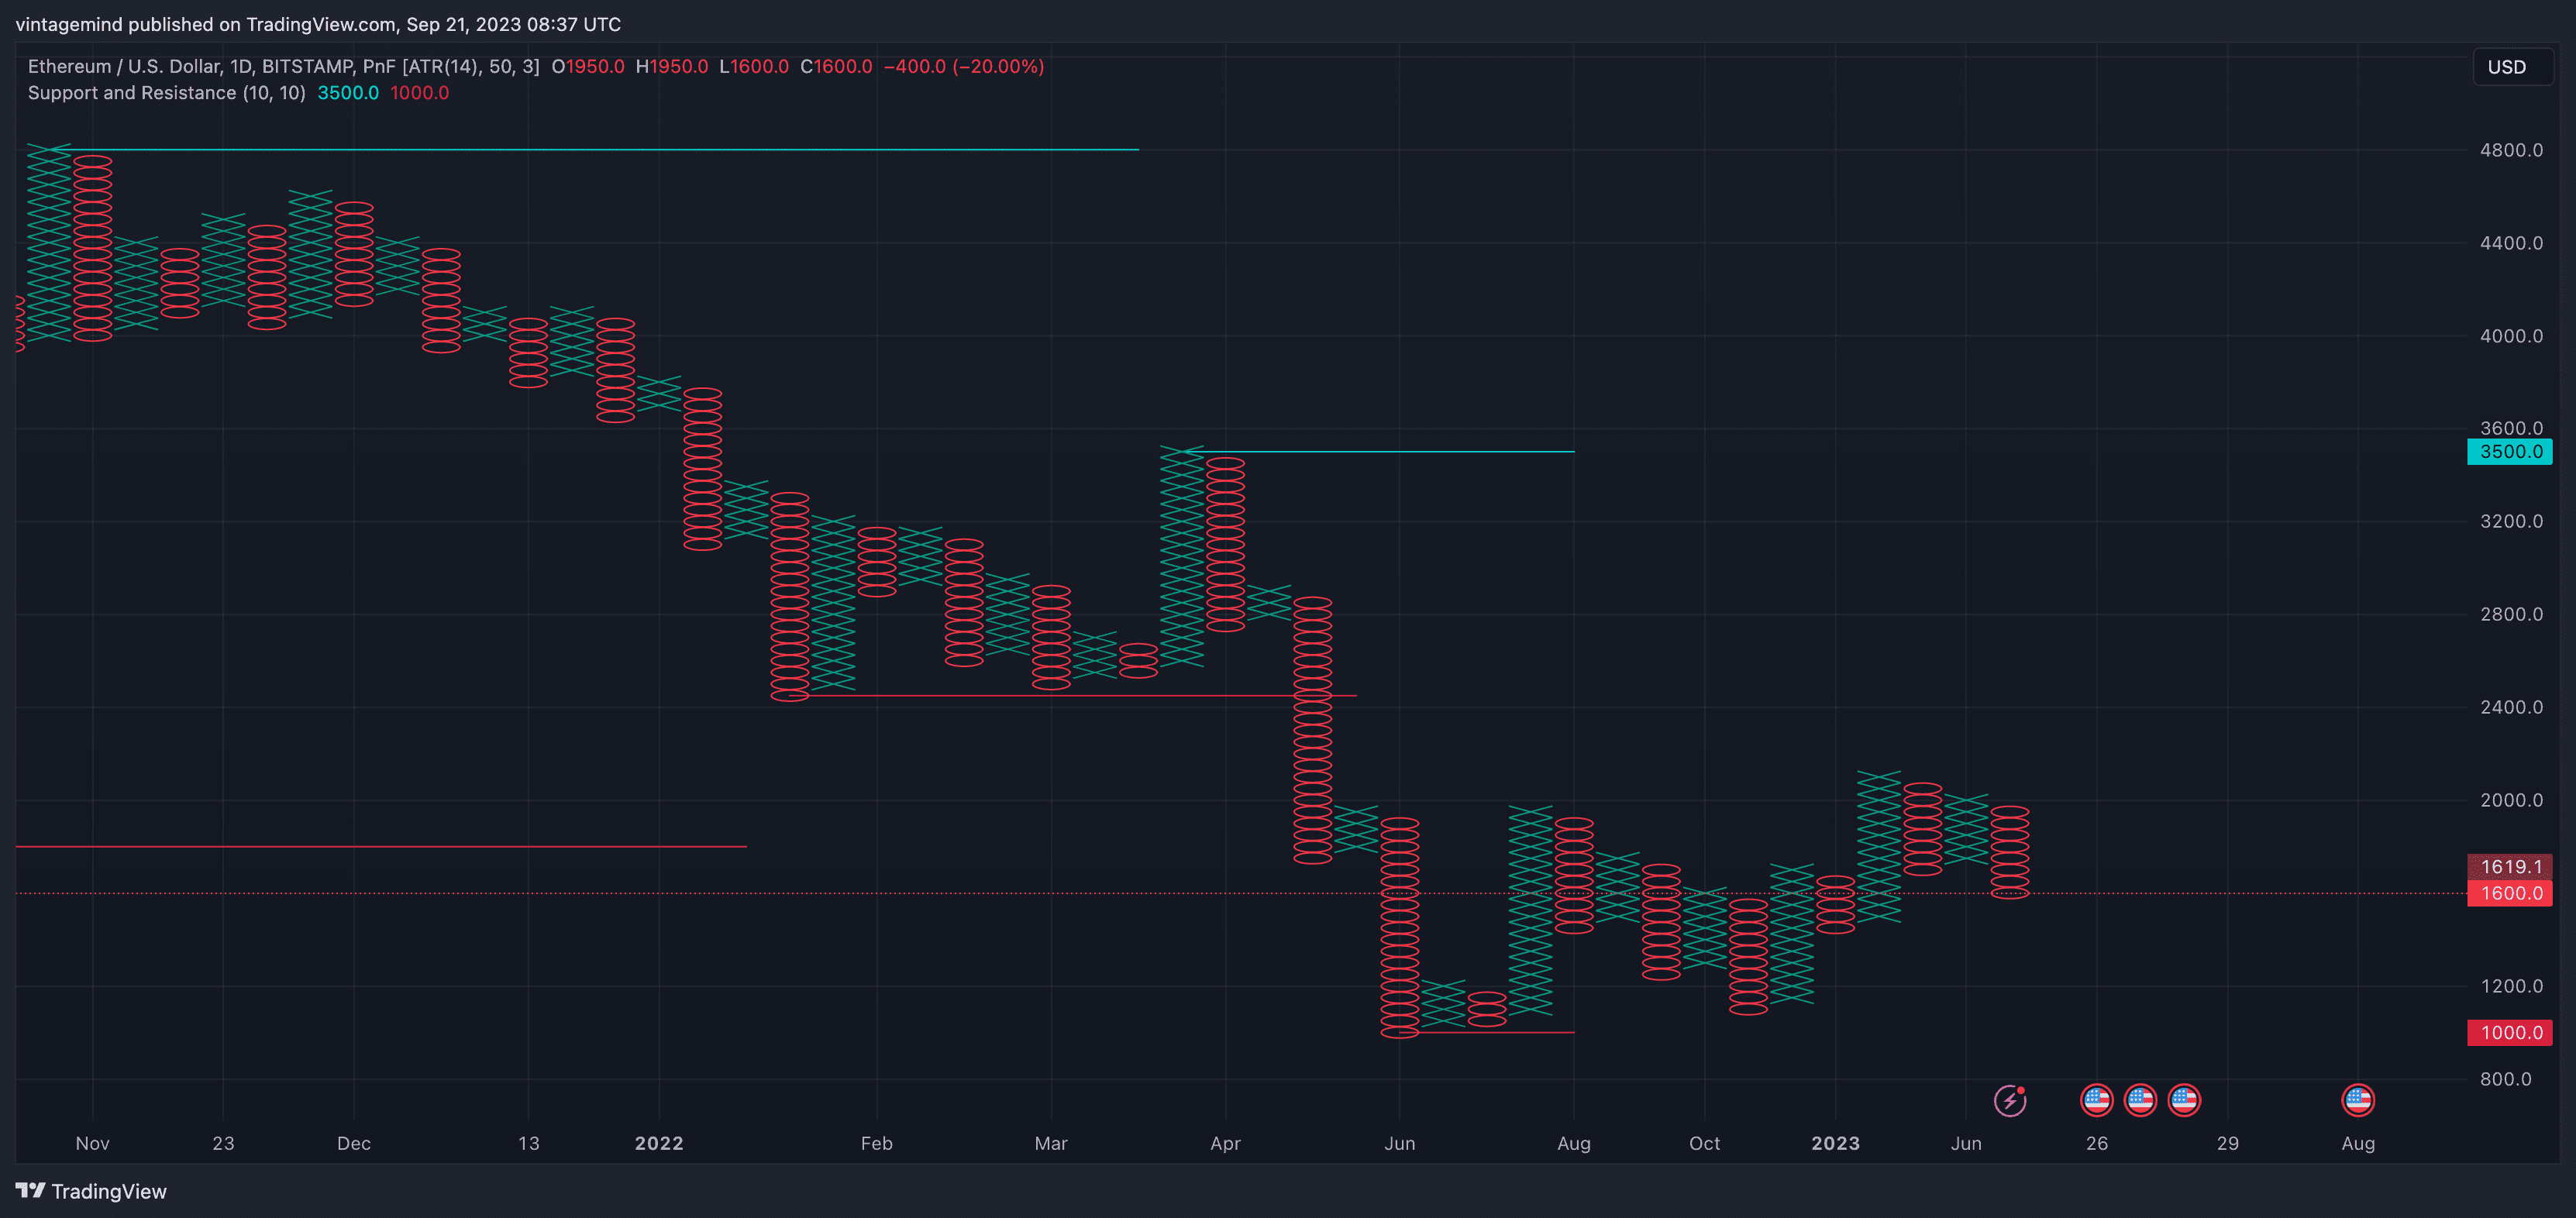
Most of the price pattens you observe will consist of variations on: Double and triple tops and bottoms, head and shoulders, V's and inverted V's, etc.
Conclusion
While point and figure charts may not be your most favorite, these charts are powerful tools as they reduce random noise, have more precision based on signals, and help you see trends much clearer. It can also be used in many different ways to identify entry and exit points. Stay safe and happy trading!
Point and Figure Charts: The Bare-Bones
Sep 20, 2023
During your time trading, you must have definitely come across point and figure charting. Point and figure charting is a very classic charting technique with it being the first one used in the modern world since 1886. Kudos to Doji for being one of the most oldest techniques.
Characteristics of Point and Figure
Above is a point and figure chart showcasing all-time data.
Below is the usual candle bar chart you most of the time view covering the same time span.
At closer inspection of the point and figure chart, you will notice the columns consist of either are x's or o's . Here x columns represent rising prices while o columns represent declining prices. Only price changes are recorded. This is why the point and figure chart looks so different. If there is no price change, there will be no changes on the chart.
Uses and Implementation
Point and figure charts are used for a variety of purposes but primary for tracking market movement. It is in fact a study of pure price movement.
Some things to keep in mind:
When a column of rising prices is one box higher than the highest rising price of the prior column, it indicates a buy signal.
When a column of declining prices is one box below the lowest declining price of the prior column, it indicates a sell signal.
If the most recent signal was a sell-short signal, the position is bearish and remains bearish until a buy signal occurs.
If the most recent signal was a buy signal, the position is bullish and remains bullish until a sell-short signal occurs.
Most of the price pattens you observe will consist of variations on: Double and triple tops and bottoms, head and shoulders, V's and inverted V's, etc.
Conclusion
While point and figure charts may not be your most favorite, these charts are powerful tools as they reduce random noise, have more precision based on signals, and help you see trends much clearer. It can also be used in many different ways to identify entry and exit points. Stay safe and happy trading!
Supercharge your trading game with Market Mapper today!