What is RSI in Crypto?
Feb 5, 2023
Think of the market like a high-speed car race. Just like a race car driver, traders and investors need to assess the strength and speed of their assets to make smart decisions. The Relative Strength Index (RSI) is like a speedometer that helps traders measure the strength of an asset’s price action.

Developed by J. Welles Wilder Jr. in 1978, the RSI is a trading indicator and is a popular momentum oscillator that compares the magnitude of a stock's recent gains to its recent losses. It's like a scoreboard that shows how well the stock is doing relative to its previous movements. The RSI is calculated by taking the average of the positive price changes in a given period and dividing it by the average of the negative price changes, resulting in a value between 0 and 100.
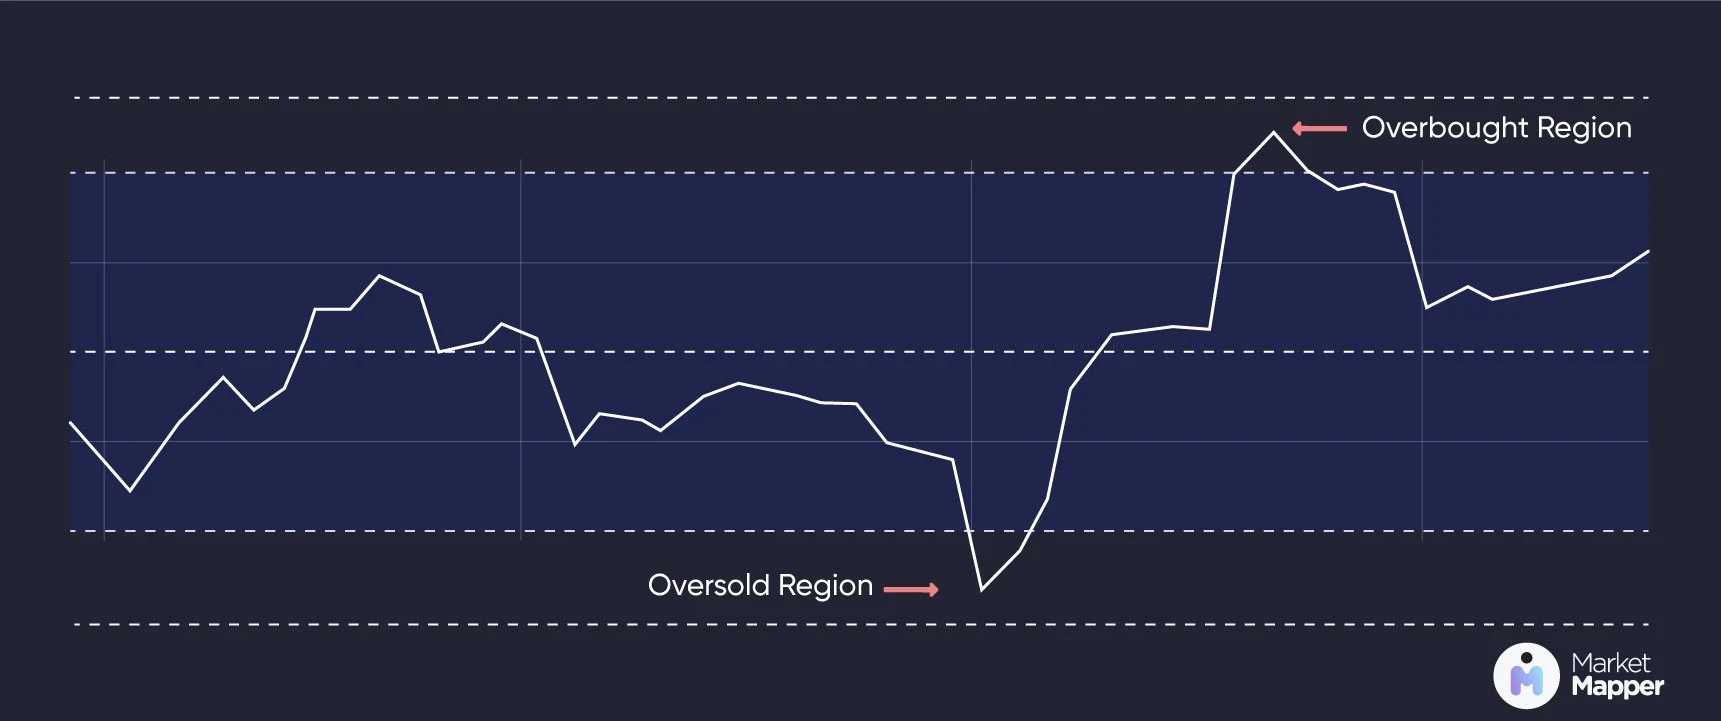
When a stock's RSI value is above 70, it's considered overbought, meaning its price has risen too fast and may be ready for a slowdown. On the other hand, if the RSI value is below 30, it's considered oversold, meaning its price has fallen too fast and may experience a bounce-back. Traders can use these signals to identify potential buying and selling opportunities.
Think of it as a race car: if a race car has been speeding ahead, traders might see this as a good time to sell, as its speed may be overextended and running out of momentum and is ready to slow down or switch direction.
On the other hand, if a race car has been lagging behind, traders might look at it as a good time to buy, as its recent downward momentum may be losing steam and ready to reverse.
Using RSI When Looking for Divergences:
Divergences can reveal discrepancies between indicators and price movements.
How to spot a bearish RSI divergence?
You can use our crypto analysis tools to find assets with RSI in the extended regions, specifically in the 70+ area, then look at the price chart and look for higher highs; meaning that the price chart has 2 peaks and the price is going higher. However, for this to be a possible divergence, the RSI indicator must show corresponding lower highs indicating a drop-off in momentum between those two peaks signaling a potential reversal downwards.
How to spot a bullish RSI divergence?
Same as the bearish, you can use our RSI screeners to find assets that are in the extended region, specifically the 30- area. Here we want to see a lower lows pattern in the price chart and a higher lows in the RSI indicator chart signaling a potential trend reversal upwards.
You can also use the following RSI divergence cheat sheet whenever you are looking for possible divergences.
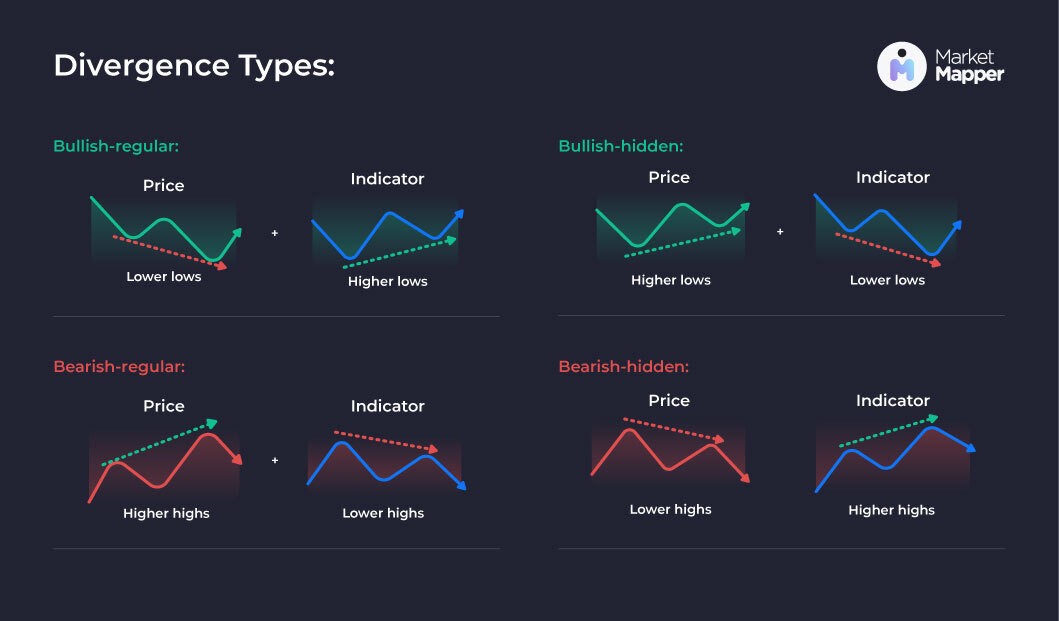
Divergence cheat sheet for different bearish divergences and bullish divergences based on the RSI indicator and finding higher/lower highs/lows in the price chart.
Traders also typically use other trend indicators to confirm these reversals, such as the Moving average convergence divergence (MACD).
Typically divergences become invalid when looking further than 14 candles away.
A good rule of thumb is to consider the 50 RSI level as a reset level, meaning a fresh start due to the price cooling off at a natural resting place or that we have a price consolidation at this level.
Remember, the RSI is just one tool in a trader's toolkit. To make informed decisions, traders should always combine it with other analysis techniques, such as trend lines, support and resistance levels, and chart patterns. Additionally, the RSI indicator could be sensitive to narrative changes or big announcements that would drive the price to correct accordingly due to trader's fear or confidence.
Using Market Mapper could help traders save time to find and take advantage of turnaround periods by using our crypto RSI screener to sort and filter the RSI value along with other indicators of all the assets available.
In conclusion, the Relative Strength Index (RSI) is a valuable tool for traders and investors to help assess market momentum and make informed decisions. By using Market Mapper traders are able to quickly spot critical moments where the momentum presents an advantageous trading position.
What is RSI in Crypto?
Feb 5, 2023
Think of the market like a high-speed car race. Just like a race car driver, traders and investors need to assess the strength and speed of their assets to make smart decisions. The Relative Strength Index (RSI) is like a speedometer that helps traders measure the strength of an asset’s price action.
Developed by J. Welles Wilder Jr. in 1978, the RSI is a trading indicator and is a popular momentum oscillator that compares the magnitude of a stock's recent gains to its recent losses. It's like a scoreboard that shows how well the stock is doing relative to its previous movements. The RSI is calculated by taking the average of the positive price changes in a given period and dividing it by the average of the negative price changes, resulting in a value between 0 and 100.
When a stock's RSI value is above 70, it's considered overbought, meaning its price has risen too fast and may be ready for a slowdown. On the other hand, if the RSI value is below 30, it's considered oversold, meaning its price has fallen too fast and may experience a bounce-back. Traders can use these signals to identify potential buying and selling opportunities.
Think of it as a race car: if a race car has been speeding ahead, traders might see this as a good time to sell, as its speed may be overextended and running out of momentum and is ready to slow down or switch direction.
On the other hand, if a race car has been lagging behind, traders might look at it as a good time to buy, as its recent downward momentum may be losing steam and ready to reverse.
Using RSI When Looking for Divergences:
Divergences can reveal discrepancies between indicators and price movements.
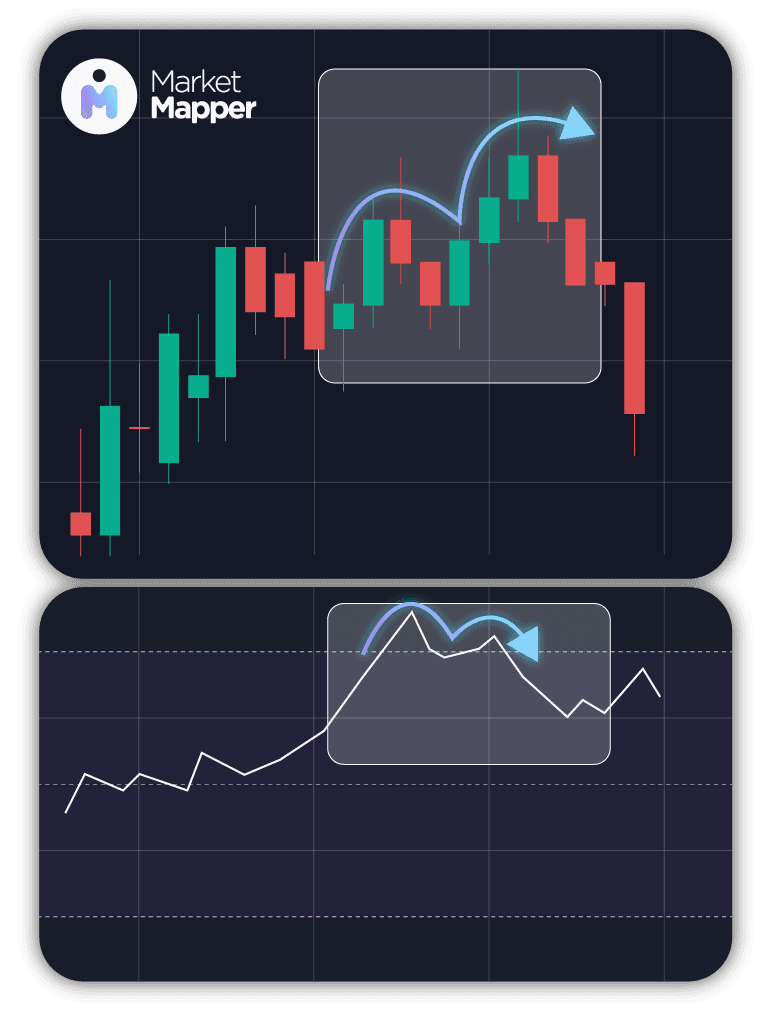
How to spot a bearish RSI divergence?
You can use our crypto analysis tools to find assets with RSI in the extended regions, specifically in the 70+ area, then look at the price chart and look for higher highs; meaning that the price chart has 2 peaks and the price is going higher. However, for this to be a possible divergence, the RSI indicator must show corresponding lower highs indicating a drop-off in momentum between those two peaks signaling a potential reversal downwards.
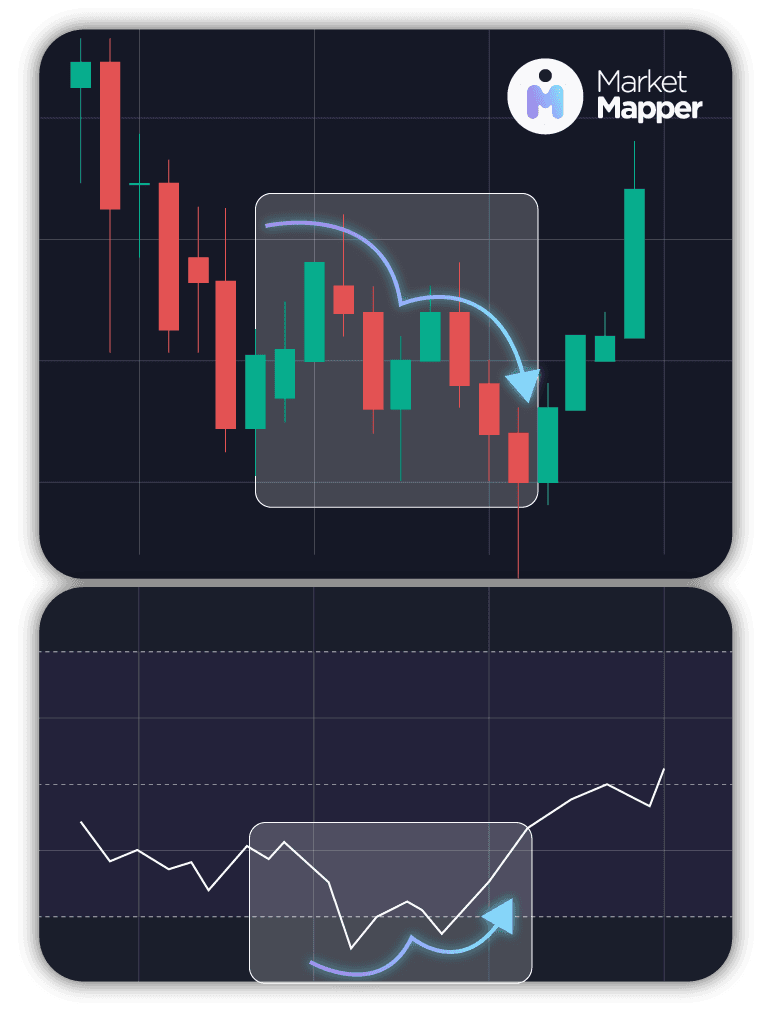
How to spot a bullish RSI divergence?
Same as the bearish, you can use our RSI screeners to find assets that are in the extended region, specifically the 30- area. Here we want to see a lower lows pattern in the price chart and a higher lows in the RSI indicator chart signaling a potential trend reversal upwards.
You can also use the following RSI divergence cheat sheet whenever you are looking for possible divergences.
Divergence cheat sheet for different bearish divergences and bullish divergences based on the RSI indicator and finding higher/lower highs/lows in the price chart.
Traders also typically use other trend indicators to confirm these reversals, such as the Moving average convergence divergence (MACD).
Typically divergences become invalid when looking further than 14 candles away.
A good rule of thumb is to consider the 50 RSI level as a reset level, meaning a fresh start due to the price cooling off at a natural resting place or that we have a price consolidation at this level.
Remember, the RSI is just one tool in a trader's toolkit. To make informed decisions, traders should always combine it with other analysis techniques, such as trend lines, support and resistance levels, and chart patterns. Additionally, the RSI indicator could be sensitive to narrative changes or big announcements that would drive the price to correct accordingly due to trader's fear or confidence.
Using Market Mapper could help traders save time to find and take advantage of turnaround periods by using our crypto RSI screener to sort and filter the RSI value along with other indicators of all the assets available.
In conclusion, the Relative Strength Index (RSI) is a valuable tool for traders and investors to help assess market momentum and make informed decisions. By using Market Mapper traders are able to quickly spot critical moments where the momentum presents an advantageous trading position.
What is RSI in Crypto?
Feb 5, 2023
Think of the market like a high-speed car race. Just like a race car driver, traders and investors need to assess the strength and speed of their assets to make smart decisions. The Relative Strength Index (RSI) is like a speedometer that helps traders measure the strength of an asset’s price action.
Developed by J. Welles Wilder Jr. in 1978, the RSI is a trading indicator and is a popular momentum oscillator that compares the magnitude of a stock's recent gains to its recent losses. It's like a scoreboard that shows how well the stock is doing relative to its previous movements. The RSI is calculated by taking the average of the positive price changes in a given period and dividing it by the average of the negative price changes, resulting in a value between 0 and 100.
When a stock's RSI value is above 70, it's considered overbought, meaning its price has risen too fast and may be ready for a slowdown. On the other hand, if the RSI value is below 30, it's considered oversold, meaning its price has fallen too fast and may experience a bounce-back. Traders can use these signals to identify potential buying and selling opportunities.
Think of it as a race car: if a race car has been speeding ahead, traders might see this as a good time to sell, as its speed may be overextended and running out of momentum and is ready to slow down or switch direction.
On the other hand, if a race car has been lagging behind, traders might look at it as a good time to buy, as its recent downward momentum may be losing steam and ready to reverse.
Using RSI When Looking for Divergences:
Divergences can reveal discrepancies between indicators and price movements.
How to spot a bearish RSI divergence?
You can use our crypto analysis tools to find assets with RSI in the extended regions, specifically in the 70+ area, then look at the price chart and look for higher highs; meaning that the price chart has 2 peaks and the price is going higher. However, for this to be a possible divergence, the RSI indicator must show corresponding lower highs indicating a drop-off in momentum between those two peaks signaling a potential reversal downwards.
How to spot a bullish RSI divergence?
Same as the bearish, you can use our RSI screeners to find assets that are in the extended region, specifically the 30- area. Here we want to see a lower lows pattern in the price chart and a higher lows in the RSI indicator chart signaling a potential trend reversal upwards.
You can also use the following RSI divergence cheat sheet whenever you are looking for possible divergences.
Divergence cheat sheet for different bearish divergences and bullish divergences based on the RSI indicator and finding higher/lower highs/lows in the price chart.
Traders also typically use other trend indicators to confirm these reversals, such as the Moving average convergence divergence (MACD).
Typically divergences become invalid when looking further than 14 candles away.
A good rule of thumb is to consider the 50 RSI level as a reset level, meaning a fresh start due to the price cooling off at a natural resting place or that we have a price consolidation at this level.
Remember, the RSI is just one tool in a trader's toolkit. To make informed decisions, traders should always combine it with other analysis techniques, such as trend lines, support and resistance levels, and chart patterns. Additionally, the RSI indicator could be sensitive to narrative changes or big announcements that would drive the price to correct accordingly due to trader's fear or confidence.
Using Market Mapper could help traders save time to find and take advantage of turnaround periods by using our crypto RSI screener to sort and filter the RSI value along with other indicators of all the assets available.
In conclusion, the Relative Strength Index (RSI) is a valuable tool for traders and investors to help assess market momentum and make informed decisions. By using Market Mapper traders are able to quickly spot critical moments where the momentum presents an advantageous trading position.
Supercharge your trading game with Market Mapper today!