Awesome Oscillator (AO) is an indicator that is non- limiting oscillator, providing insight into the weakness or the strength of a stock. It is used to measure market momentum and to affirm trends or to anticipate possible reversals.
When the AO value is above the zero line, it indicates a bullish trend, meaning that the short-term moving average is higher than the long-term moving average indicating that the stock's price might be on the rise.
On the other hand, if the AO value is below the zero line, it indicates a bearish trend, meaning that the short-term moving average is lower than the long-term moving average and the stock's price is likely to fall.
Read more here.
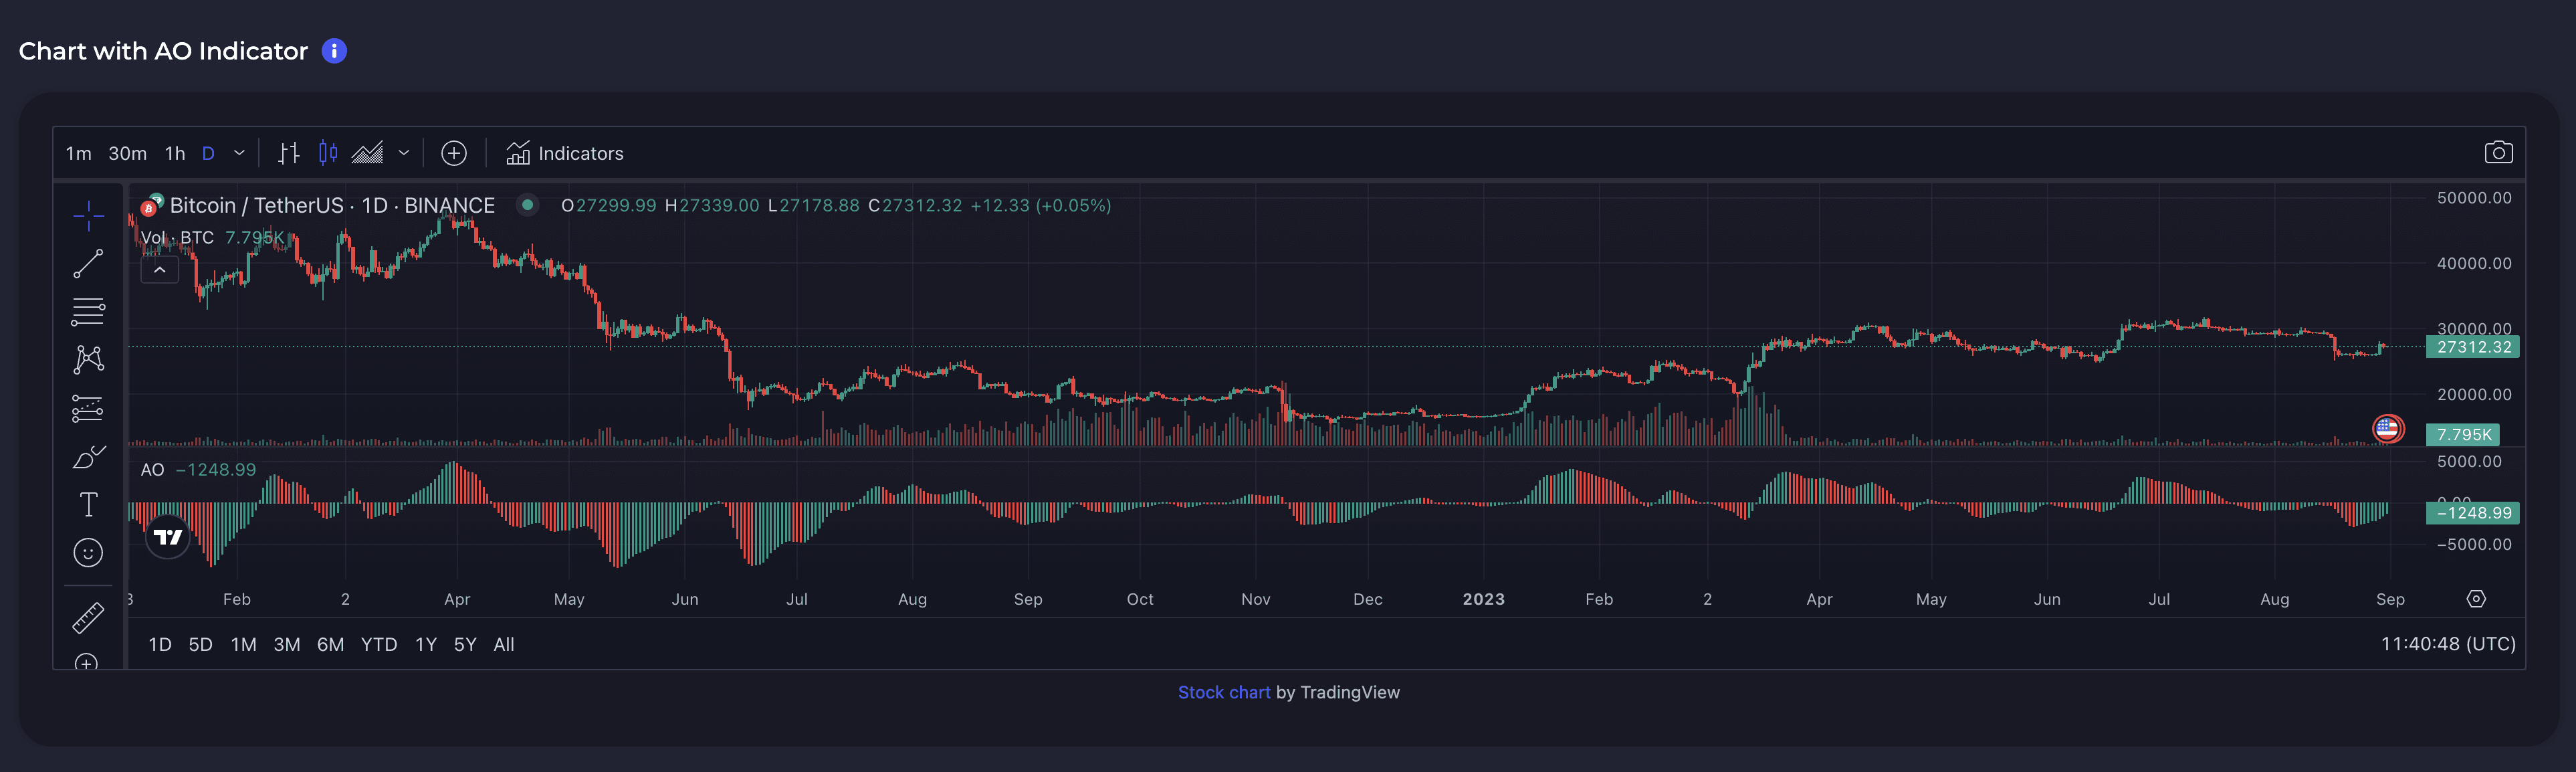
BTC AO
Bitcoin's Awesome Oscillator indicator graph from Trading View.

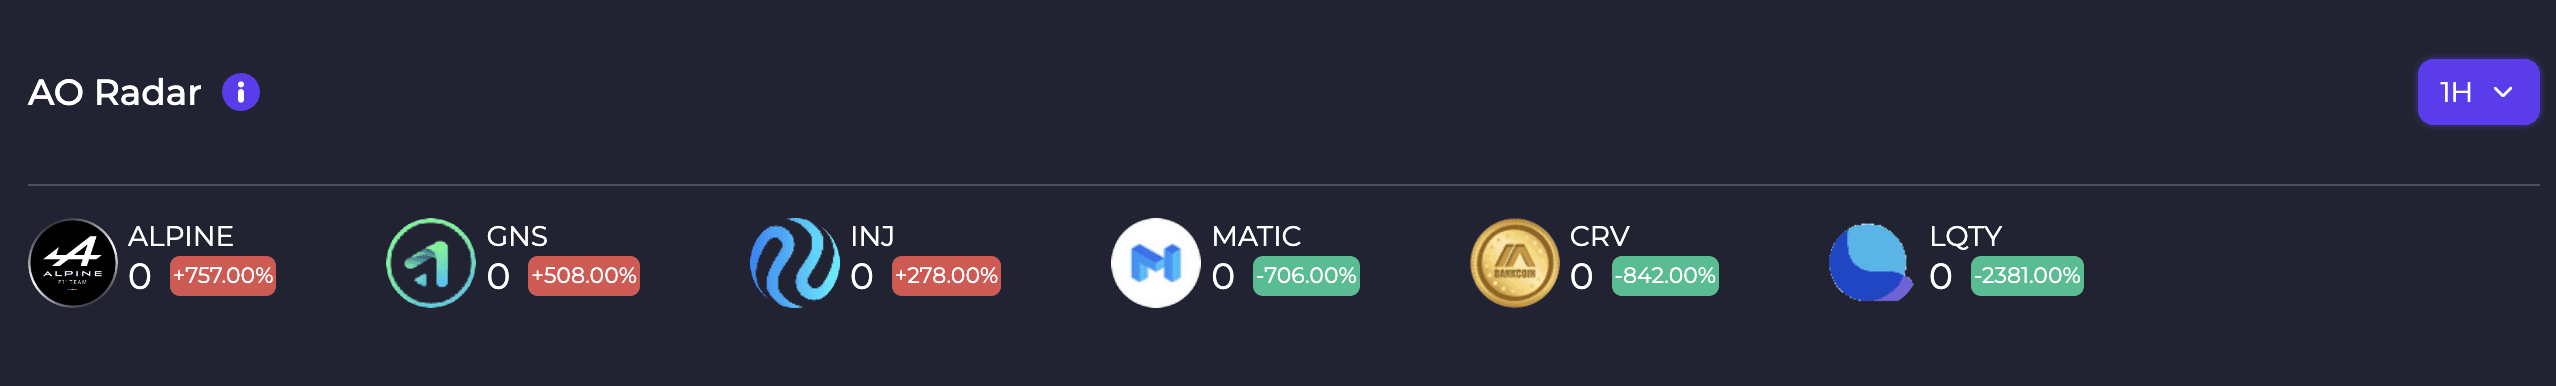
AO Radar
Easily access TradingView chart while accessing the dashboard for convenience.
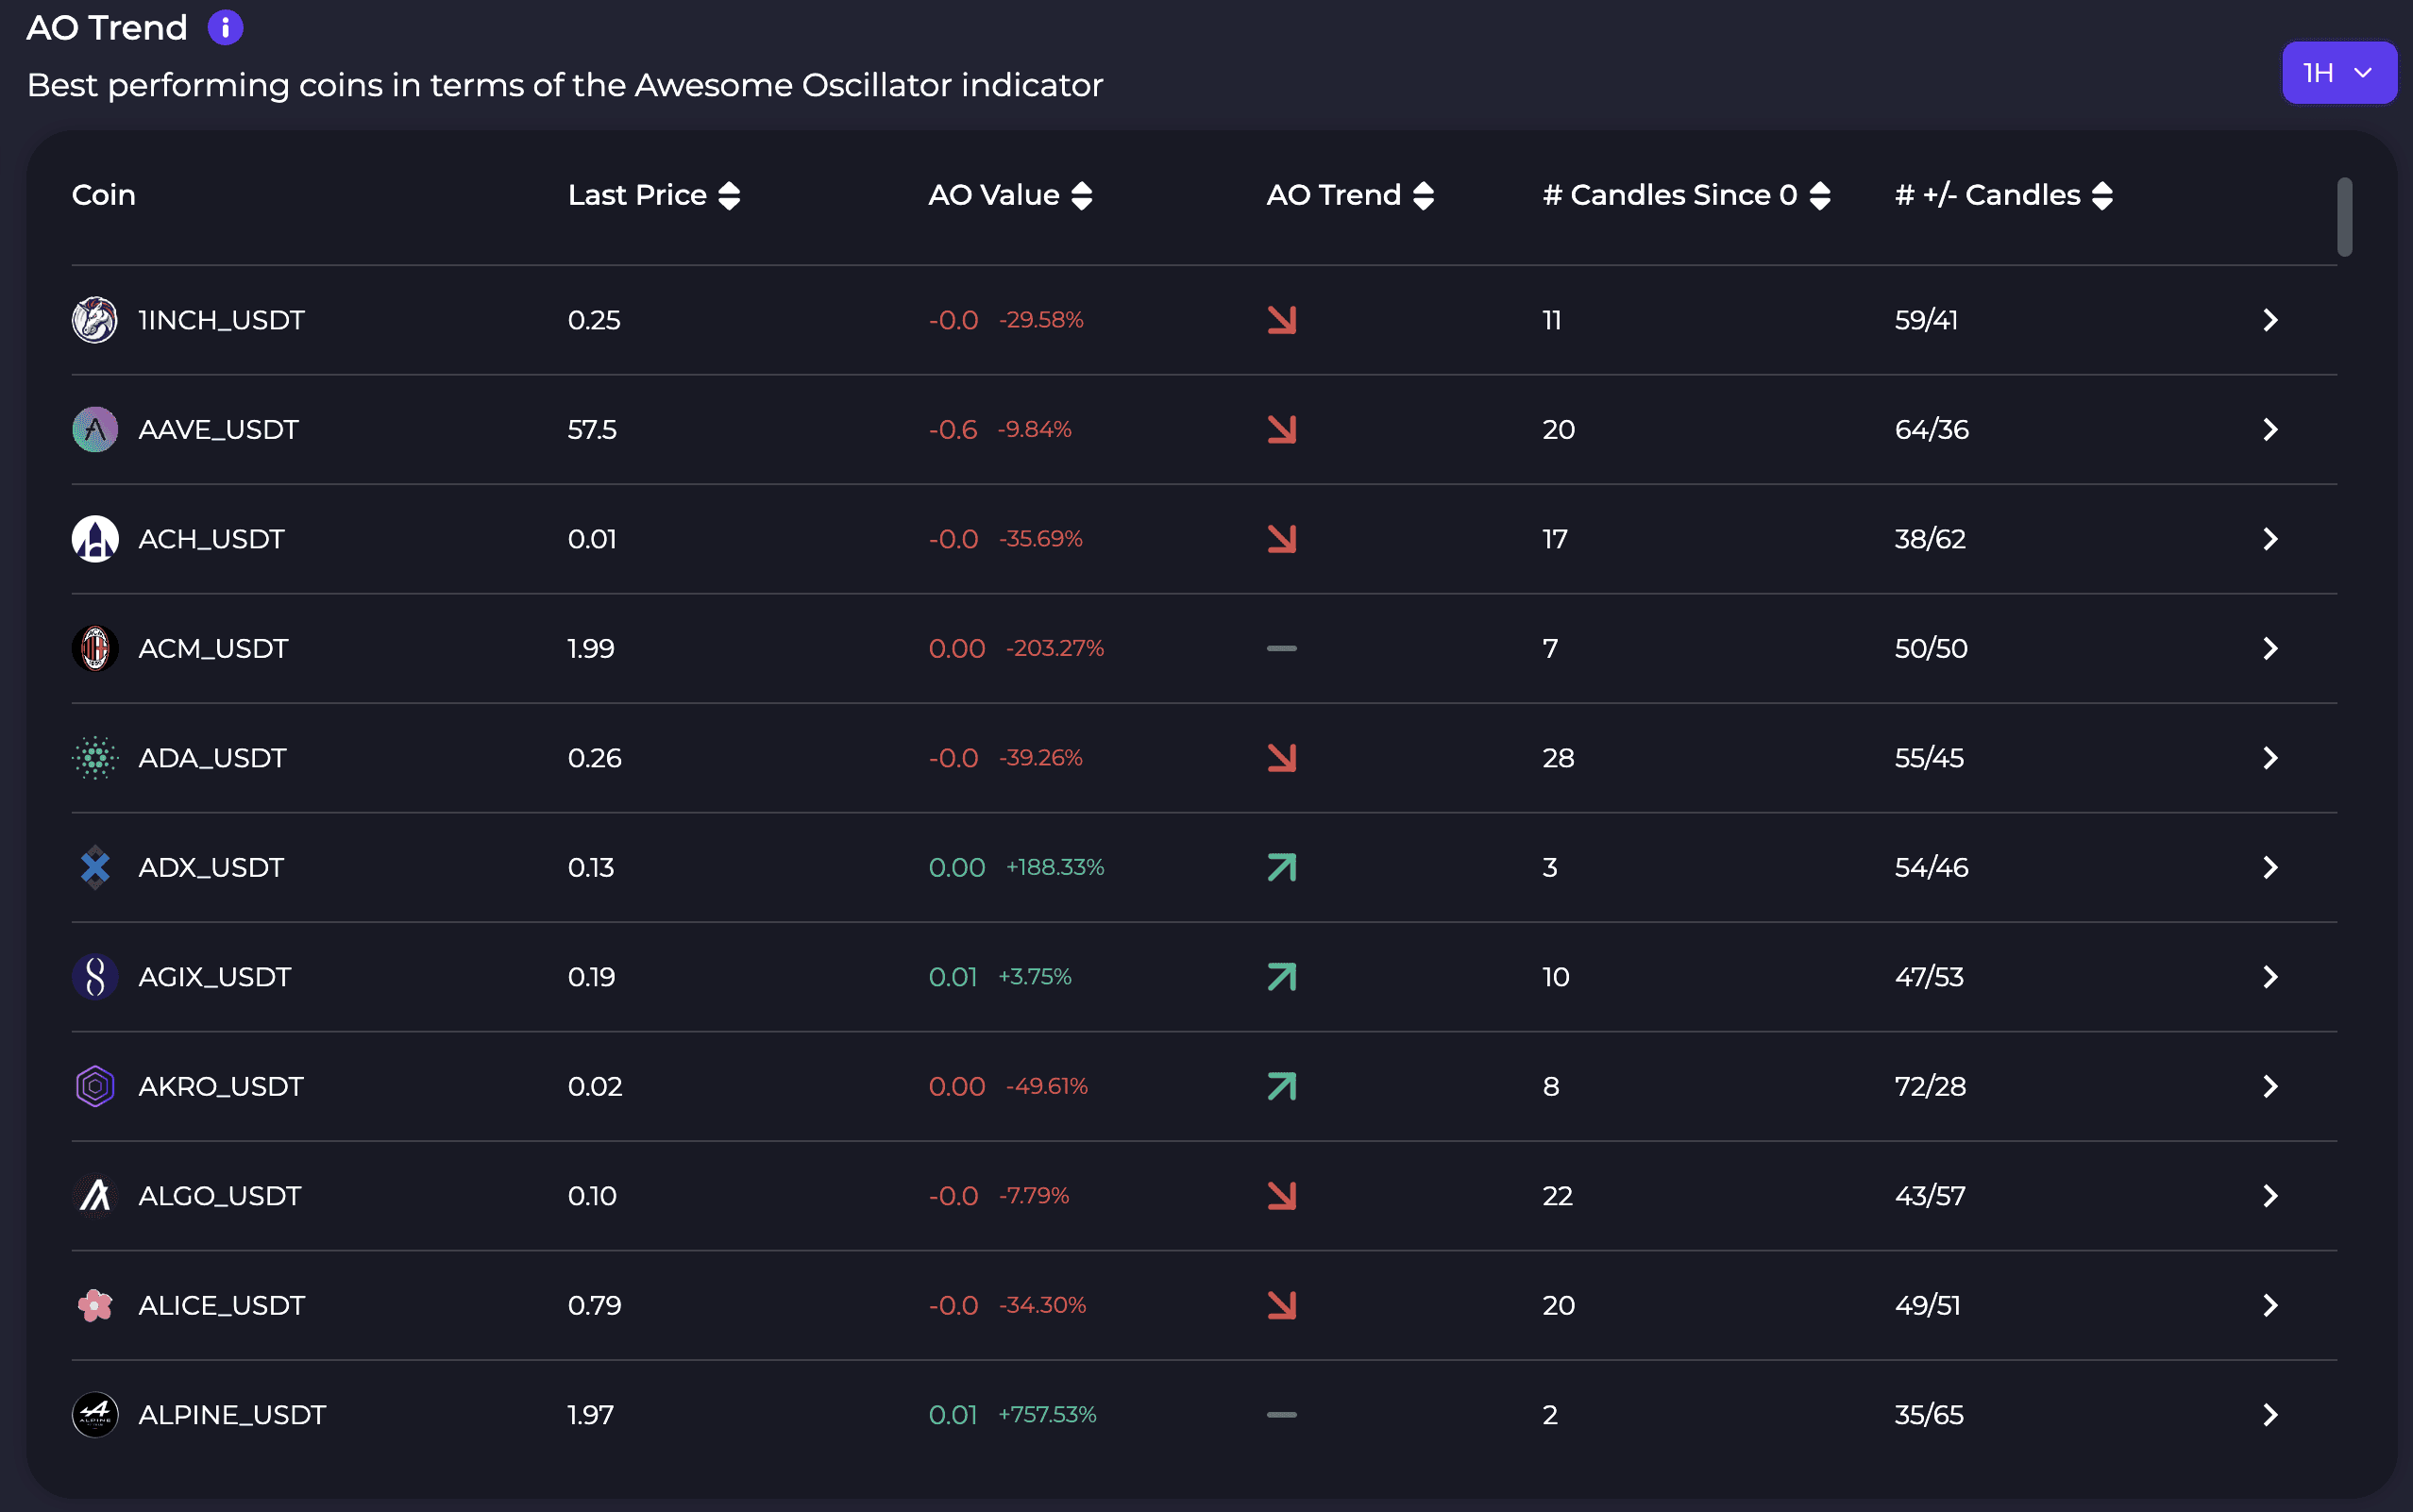
AO Trend
Best performing coins on the Awesome Oscillator indicator. These are the coins with the highest/lowest AO value in the market.
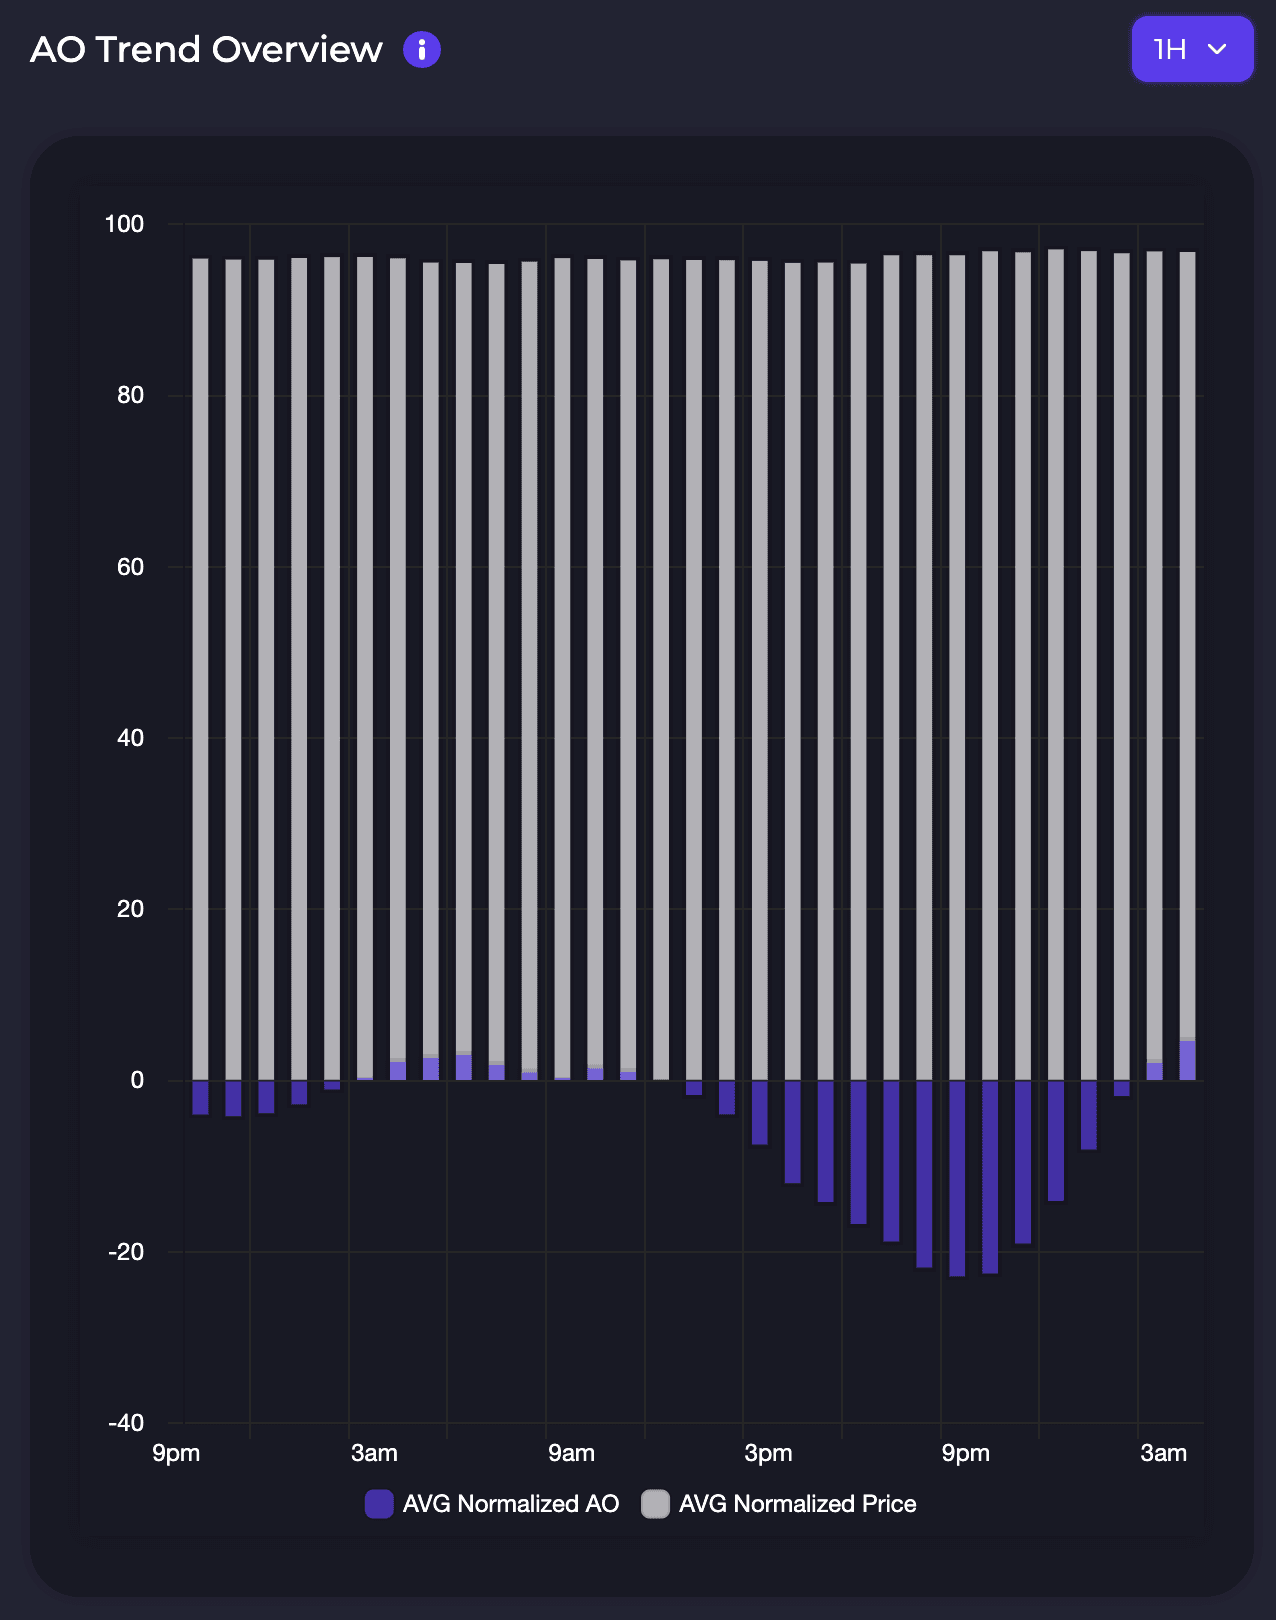
AO Trend Overview
The normalized market AO value compared to the normalized market price value. This can help you anticipate the general market trend.
AO Watchlist
Coins you have on your watchlist that are currently in Market Mapper's top 50 AO related coins.
These top 50 have the most extreme AO value in the market, whether highest or lowest.
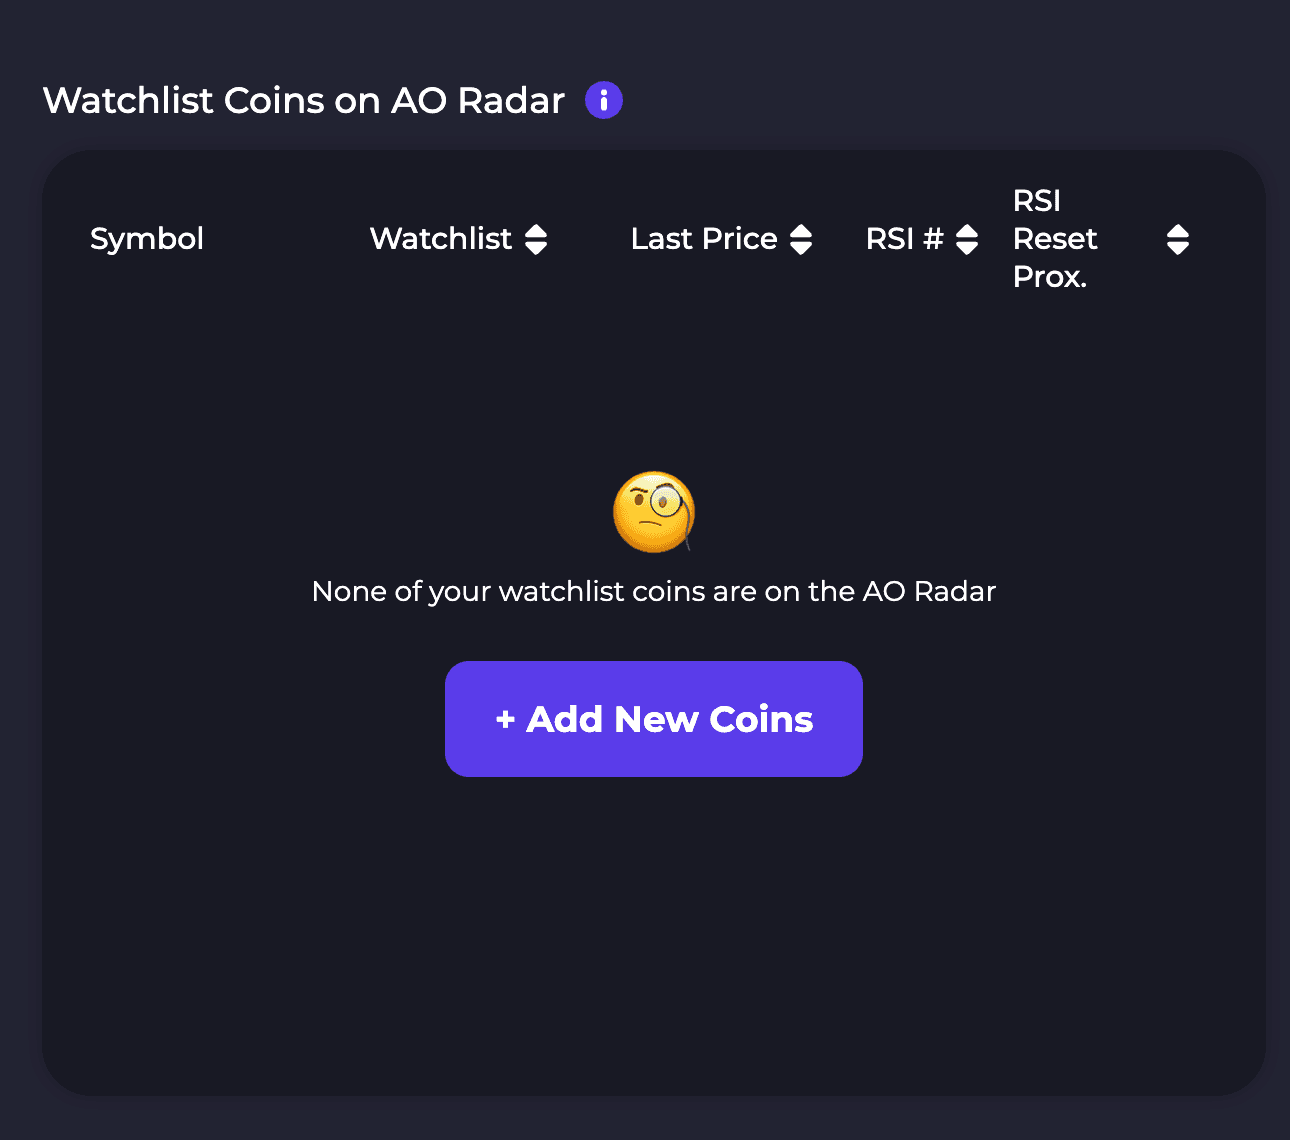
Chart with AO Indicator
Easily access TradingView chart while accessing the dashboard for convience.