
What does MACD stand for? MACD stands for Moving Average Convergence Divergence.
How to calculate the MACD indicator?
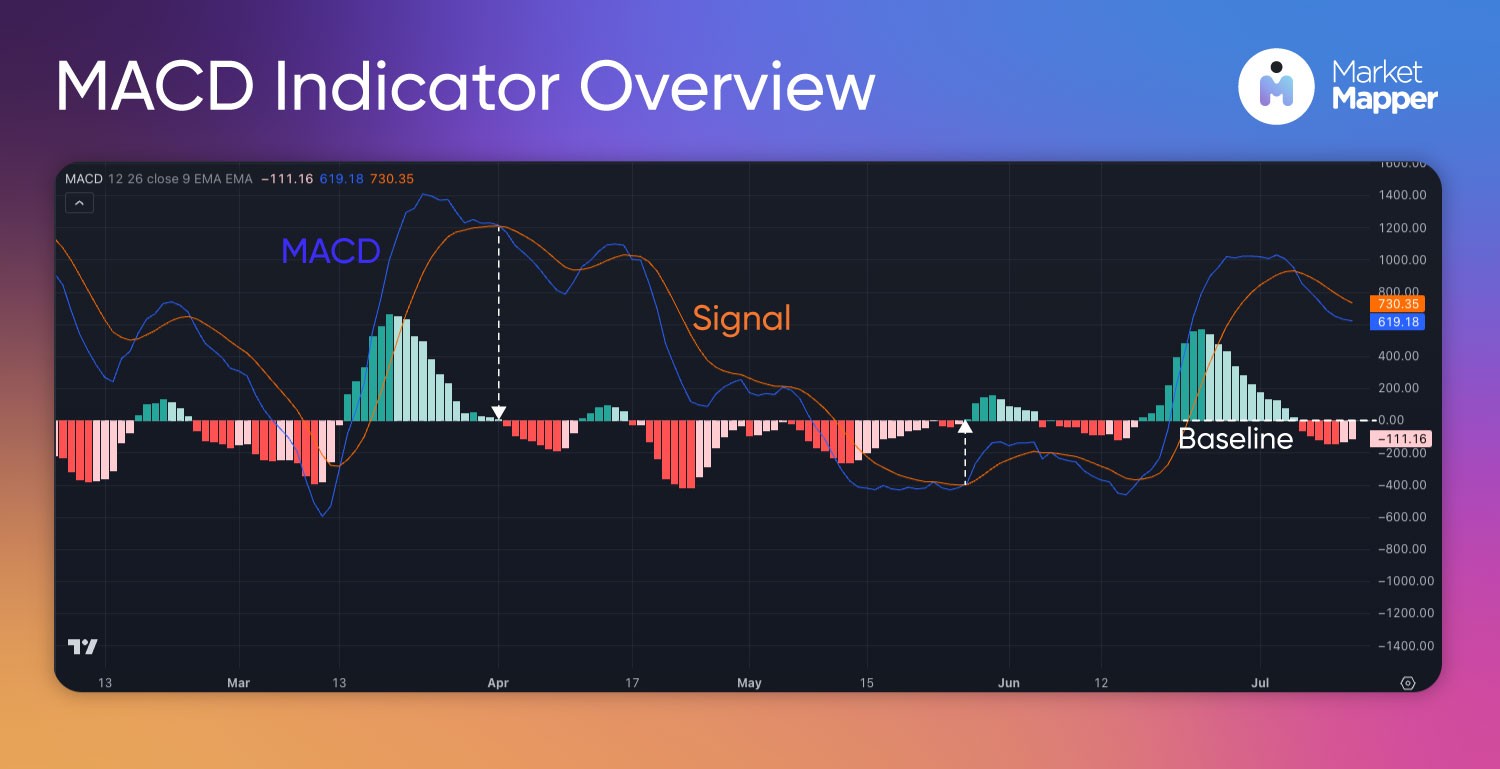
When looking at the MACD indicator you usually look at 2 lines, the first being the MACD line which is calculated as the difference between the 12 day exponential moving average (EMA) and the 26 EMA. MACD = EMA_12 - EMA_26
The second line is called the Signal line, which is calculated by taking the 9 day EMA of the MACD line.
In some instances you might notice a difference in smoothness between the candlestick charts for stocks and for cryptocurrencies.
For stock trading you have fixed hours, days off for weekends and holidays, giving the companies time to create news and momentum from releasing new products or even scandals by senior executives.
These types of events cause a squeeze or sudden spike in supply and demand since the trader sentiment can change and build up until the market is open.
On the other hand, this is less likely to happen when trading in crypto due to crypto trading hours being 24/7. One of the pros of the MACD line is that it relies on moving averages, making sudden spikes or outliers less important in the overall trend.
Indications of overbought or oversold assets:
You might be looking for a buy and sell indicator, while many exist in various forms, one popular signal is an asset being thought of as overbought or oversold, usually indicating a reversal.
If you remember from our RSI blog, we talk about a clear indication for this.
Since the RSI Indicator calculation results in a value between 0 and 100, the asset is considered overbought when it enters the 70+ region, and is considered oversold when it enters the 30- region.
However for the MACD indicator it is not so clear, there is no one value that will show you the answer.
What needs to be done is to compare the MACD and signal lines to the candlestick price charts.
Find the corresponding peaks in both the MACD and in the price chart and combine it with the RSI indicator in order to confirm that the asset is leaning into the extended region.
You will not always find that the RSI and MACD indicate the same thing, and that is because they measure momentum differently, RSI could be showing that we are now in the extended region, and the MACD might still have some momentum and the price would continue to go with the trend.
Always remember that there are a lot of false positives while looking for divergences and trend reversals, to mitigate some of that risk, you might want to wait for a confirmation candle and of course, always set a take profit and stop loss in order to minimize your risk when opening a trade.
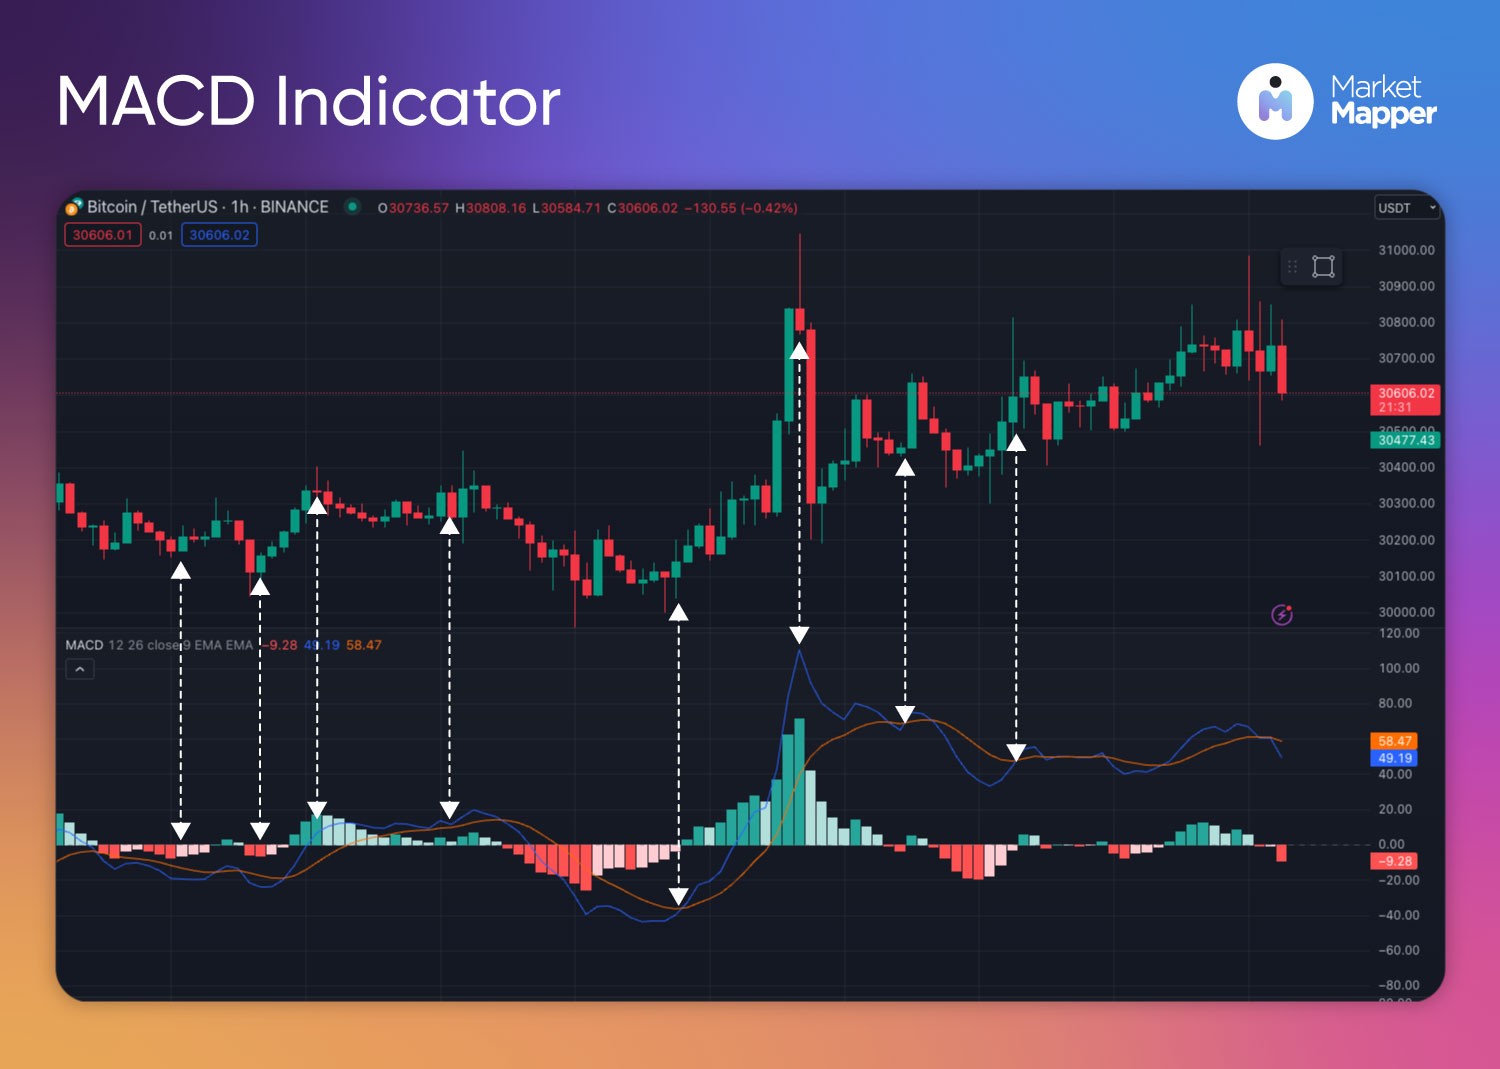
Let’s talk crossovers, and no we're not talking about a surprise appearance of the Flash. Crossovers of the MACD and signal lines can indicate bullish or bearish divergences for instance, when the MACD goes over the signal line, this could be an indicator of a bullish signal driving the price to go even higher. The other way around is for the MACD line to cross under the signal line indicating a bearish sell signal.
If you spotted a divergence that is going along with the current longer term trend, it is a stronger divergence signal (even stronger if it is combined with a crossover).
Not unlike the RSI indicator, you can use the same cheat sheet in order to find bullish or bearish divergences. Feel free to download this cheat sheet and have it open for convenience while looking for potential trades.
Divergence types cheat sheet
As you can see from the image above a bullish divergence can be found when the price chart starts to show higher highs while the MACD line starts to show lower highs, indicating a bearish divergence.
And when the price chart shows lower lows and the MACD indicator is showing higher lows, this tells us that it could be a bullish divergence.
Final thoughts:
MACD is a very useful tool in any trader’s toolbox, especially when combined with other indicators. However scanning for these across hundreds of assets is time consuming, but luckily here at Market Mapper, we are working to add this indicator to our crypto analysis tools for faster screening and for advanced trading signal alerts!
As always, stay calm, and stay informed while trading.