
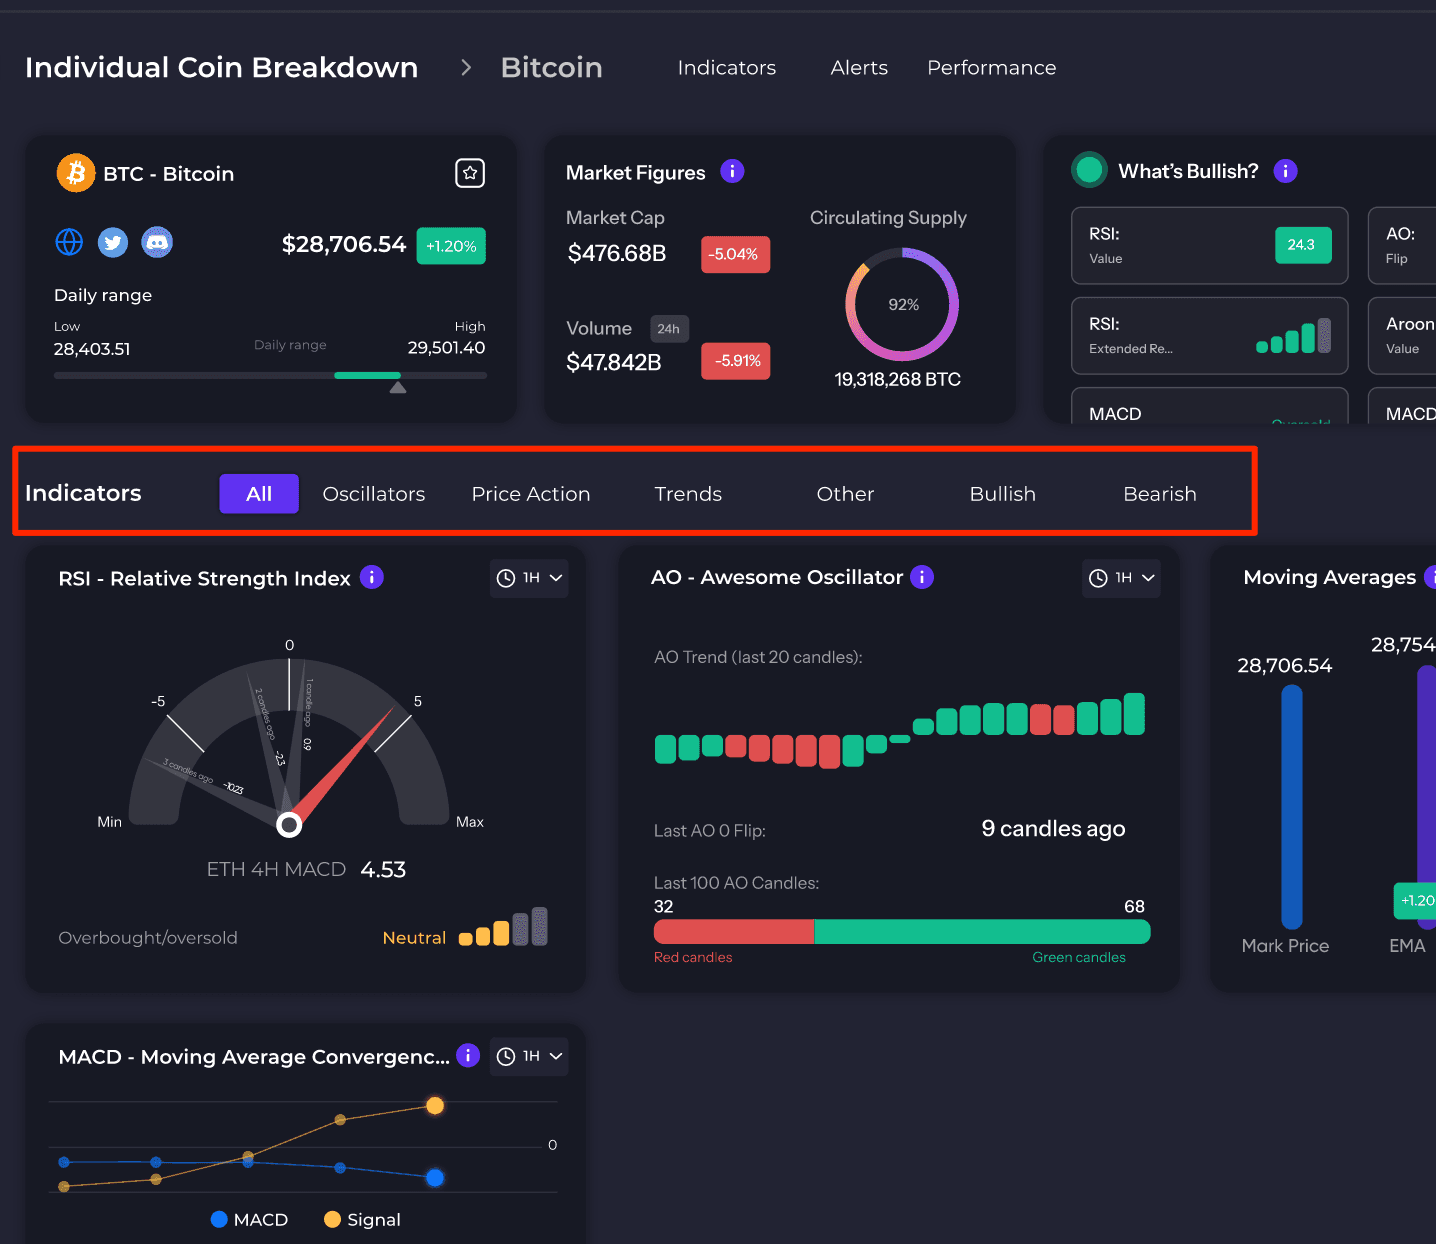
Every cryptocurrency has its own individual breakdown. It lets you view various technical indicators that are entirely focused on the selected individual cryptocurrency. The purpose for this is to be able to get a detailed in-depth technical analysis of the chosen token. This feature goes for countless coins.

Types of Indicators
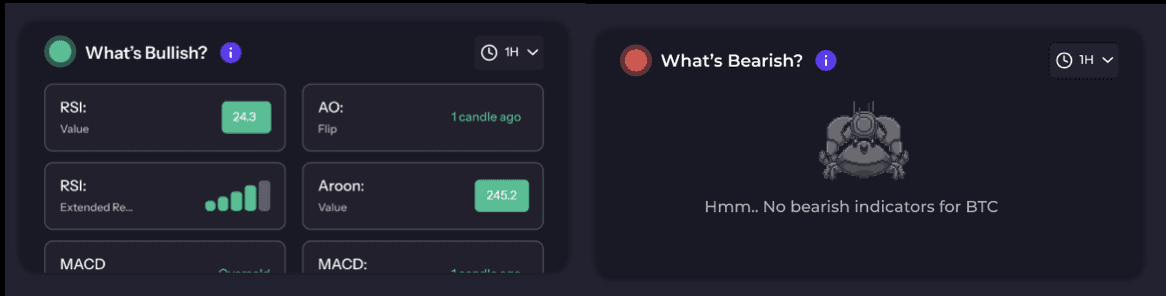
Identifying Bullish/Bearish
Any technical indicator that displays bullish data, will feature a green dot on the top right hand corner of the indicator.
Any technical indicator that displays bearish data, will feature a green dot on the top right hand corner of the indicator.
You are given the ability to quickly see what technical indicators are bearish or bullish. Head over to What’s Bearish and What’s Bullish to find out more.
To view indicators based on indicator categories, simply click on the type you wish for.
Moving Averages
We provide SMA (simple moving average), EMA (exponential moving average), and the general average of the mark price.

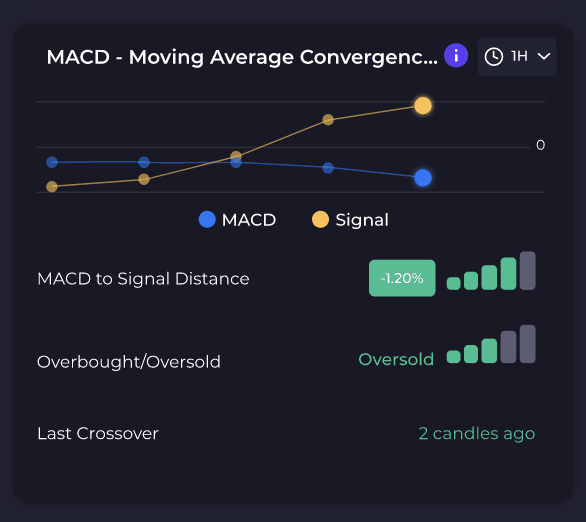
MACD - Moving Average Convergence Divergence
The difference between two exponentially smoothed moving averages of closing prices (usually the last 12 and 26 days or weeks). An overbought condition is present when the lines are too far above the zero line. An oversold condition is present when the lines are too far below the zero line.
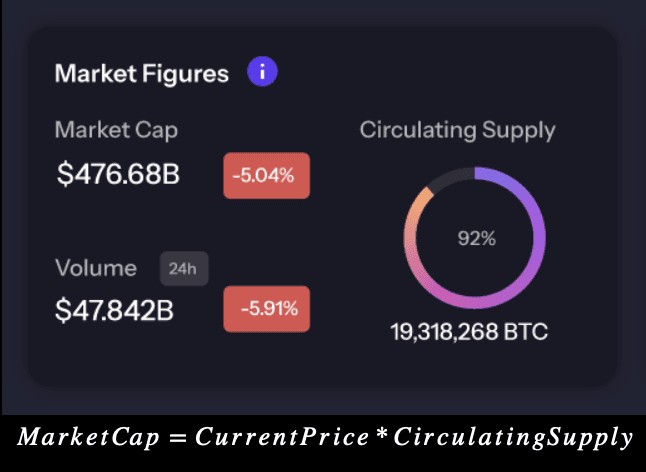
Market Figures
Market cap is the total market value of a cryptocurrency circulating supply.
Volume is the total value of the cryptocurrency traded in the last 24 hours.
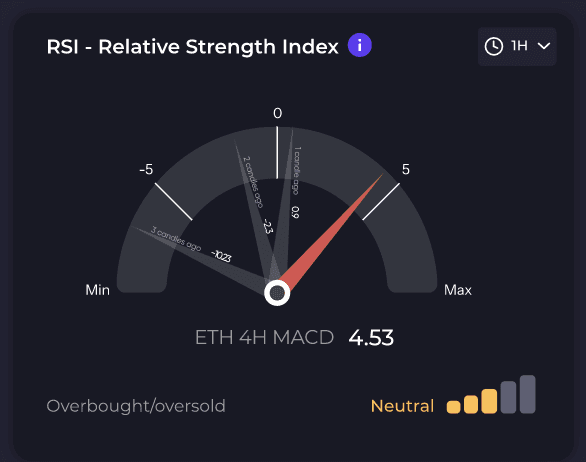
RSI - Relative Strength Index
Quickly spot overbought conditions or oversold conditions.
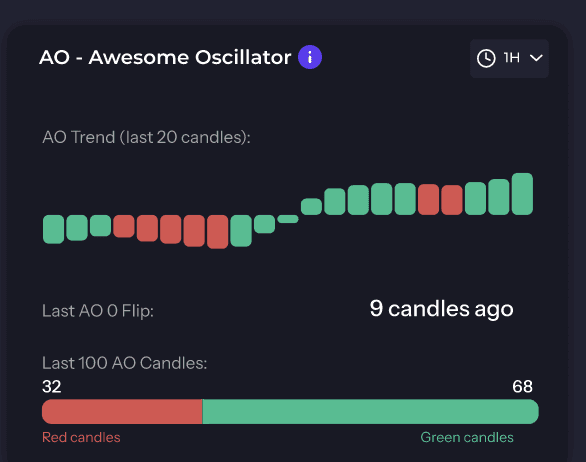
AO - Awesome Oscillator
Confirm a trend and anticipate a potential reversal of the trend. Measure both convergence and divergence of the asset’s price.
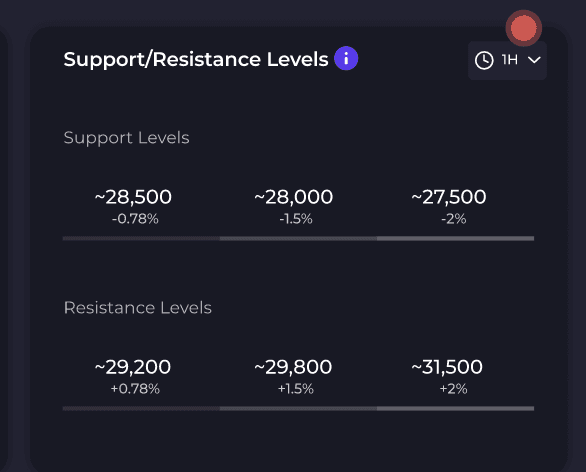
Support/Resistance
Support/resistance levels in the selected time frame, showing the 3 closest levels in each range.
Performance
The performance indicator is a performance comparison tool where you can compare indicators and price performance for all available indicators and cryptocurrencies. The more the spider graph is covered, the higher the probability to long or short (depending which you’ve chosen).
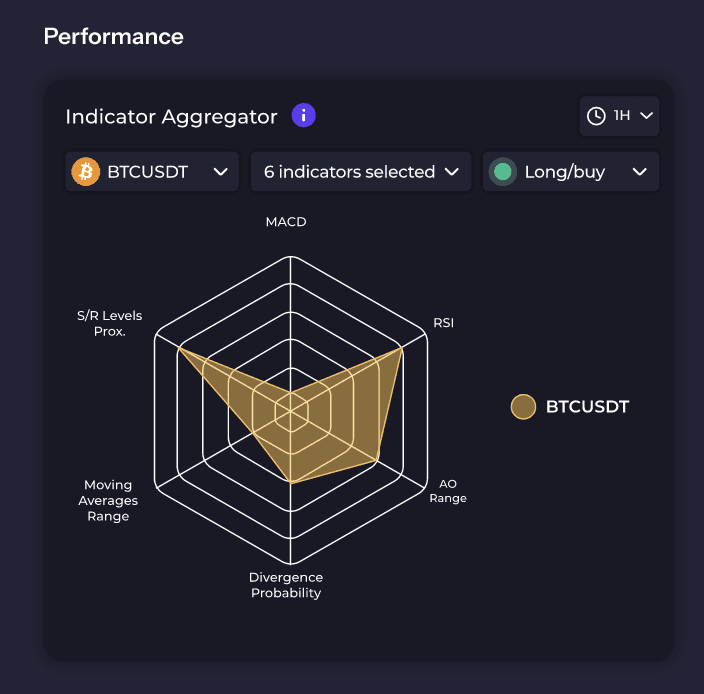
Choose the token you want to view.
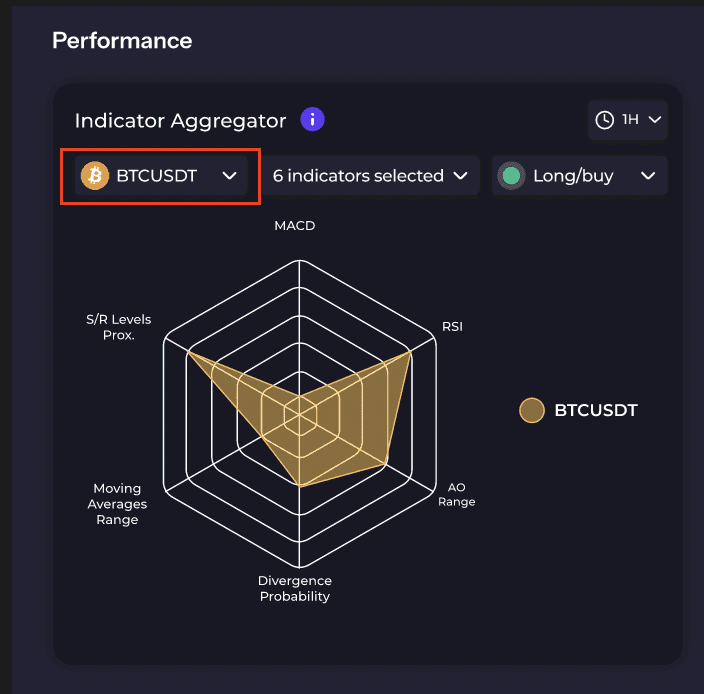
Choose up to six different indicators.
RSI (Relative Strength Index)
AO (Awesome Oscillator)
EMA (Exponential Moving Average)
SMA (Simple Moving Average)
Support/resistance levels
MACD (Moving Average Convergence Divergence)
ATH/ATL (All Time High/All Time Low)

Find whether there is an optimal environment/market to long or short. Simply select which action you would like to do.
