The RSI is a trading indicator and is a popular momentum oscillator that compares the magnitude of a stock's recent gains to its recent losses. It is calculated by taking the average of the positive price changes in a given period and dividing it by the average of the negative price changes, resulting in a value between 0 and 100.
There are two conditions: oversold and overbought. When a stock's RSI value is above 70, it's considered overbought, meaning its price has risen too fast and may be ready for a slowdown. If the RSI value is below 30, it's considered oversold, meaning its price has fallen too fast and may experience a bounce-back.
Traders can use these signals to identify potential buying and selling opportunities. Read more here.
RSI Dashboard
RSI Radar
The coins with the hottest RSI value in the market at the selected timeframe.

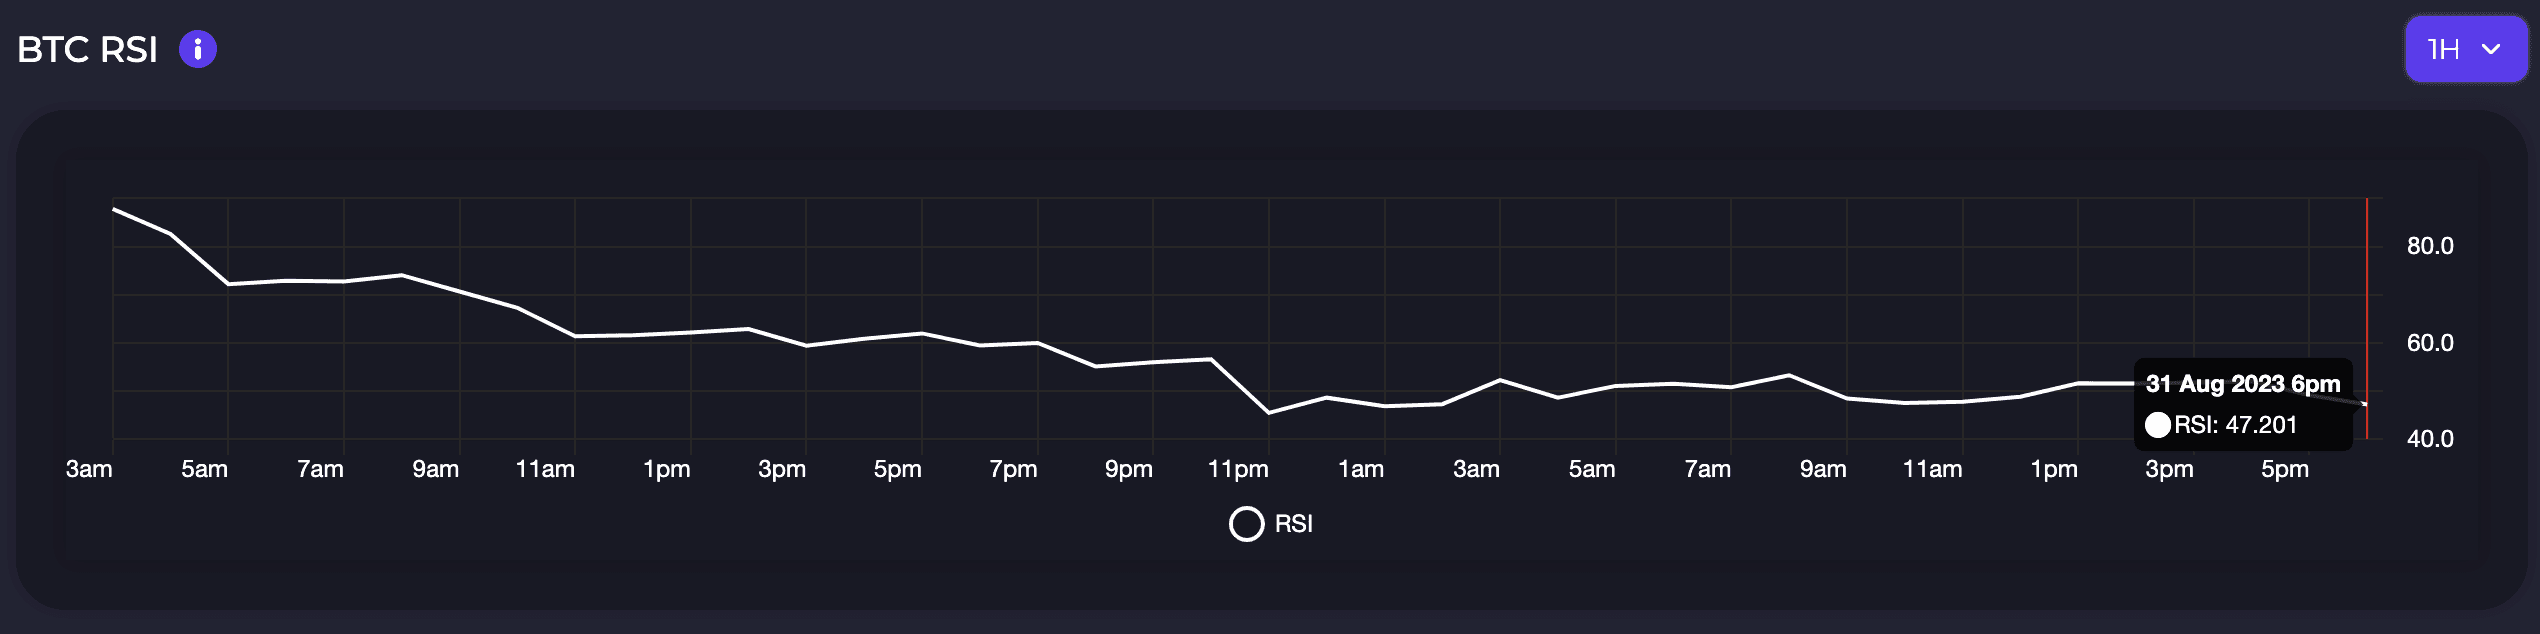
BTC RSI
The BTC RSI is from TradingView's RSI index data.
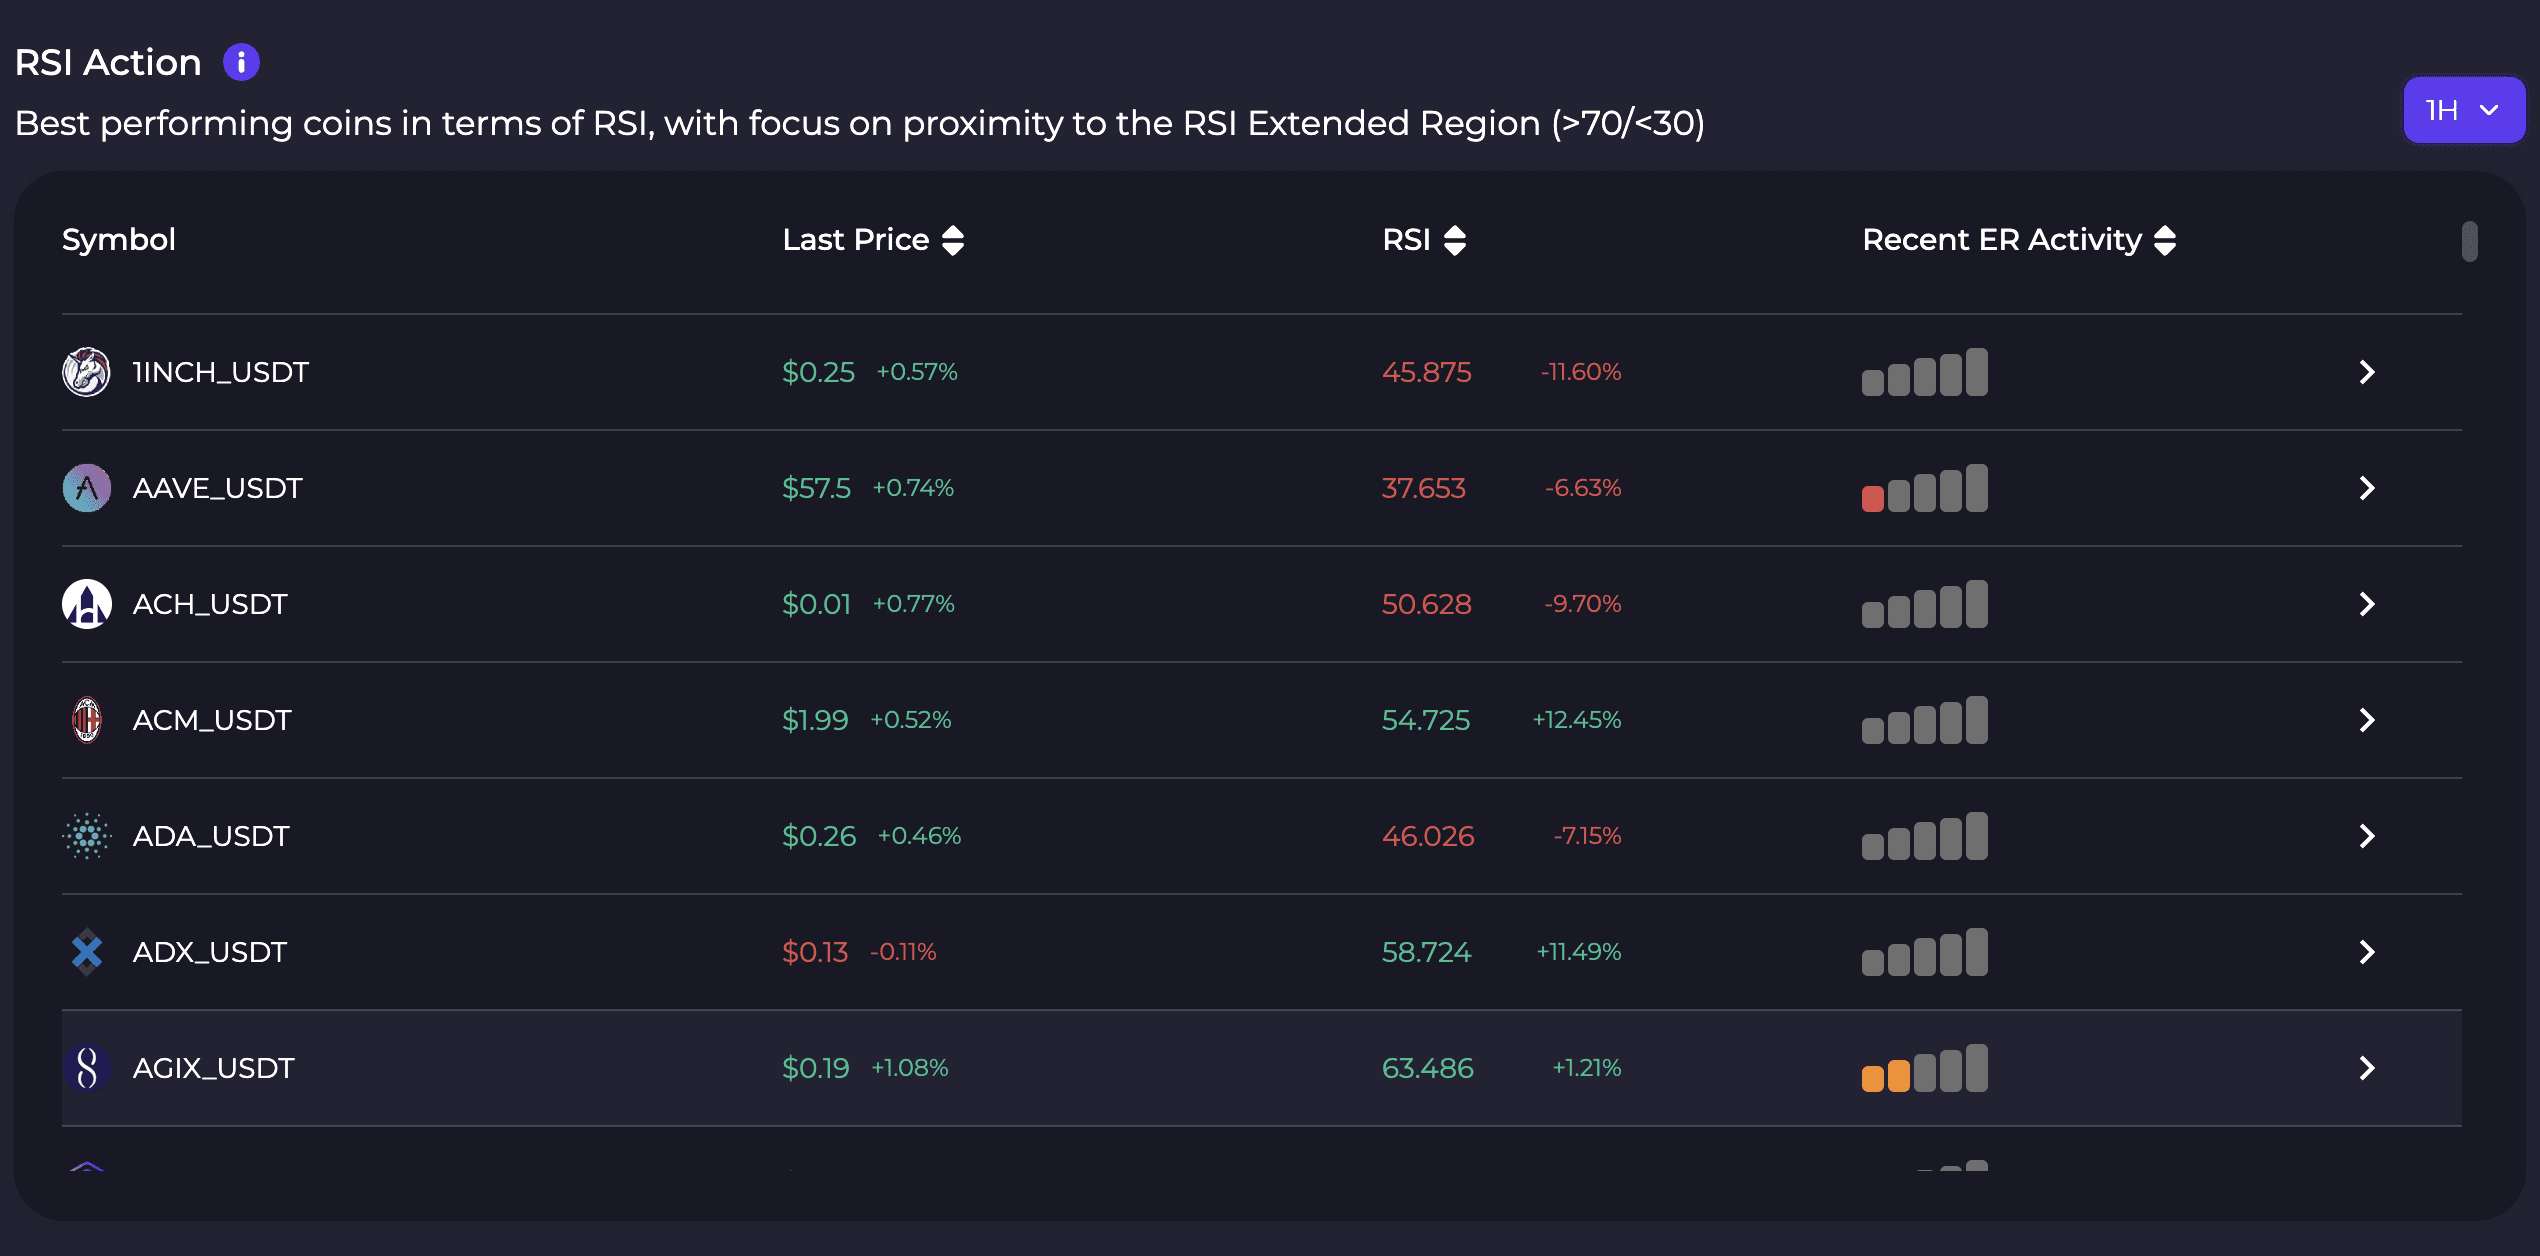
RSI Action
The coins with the hottest RSI value in the market at the selected timeframe.
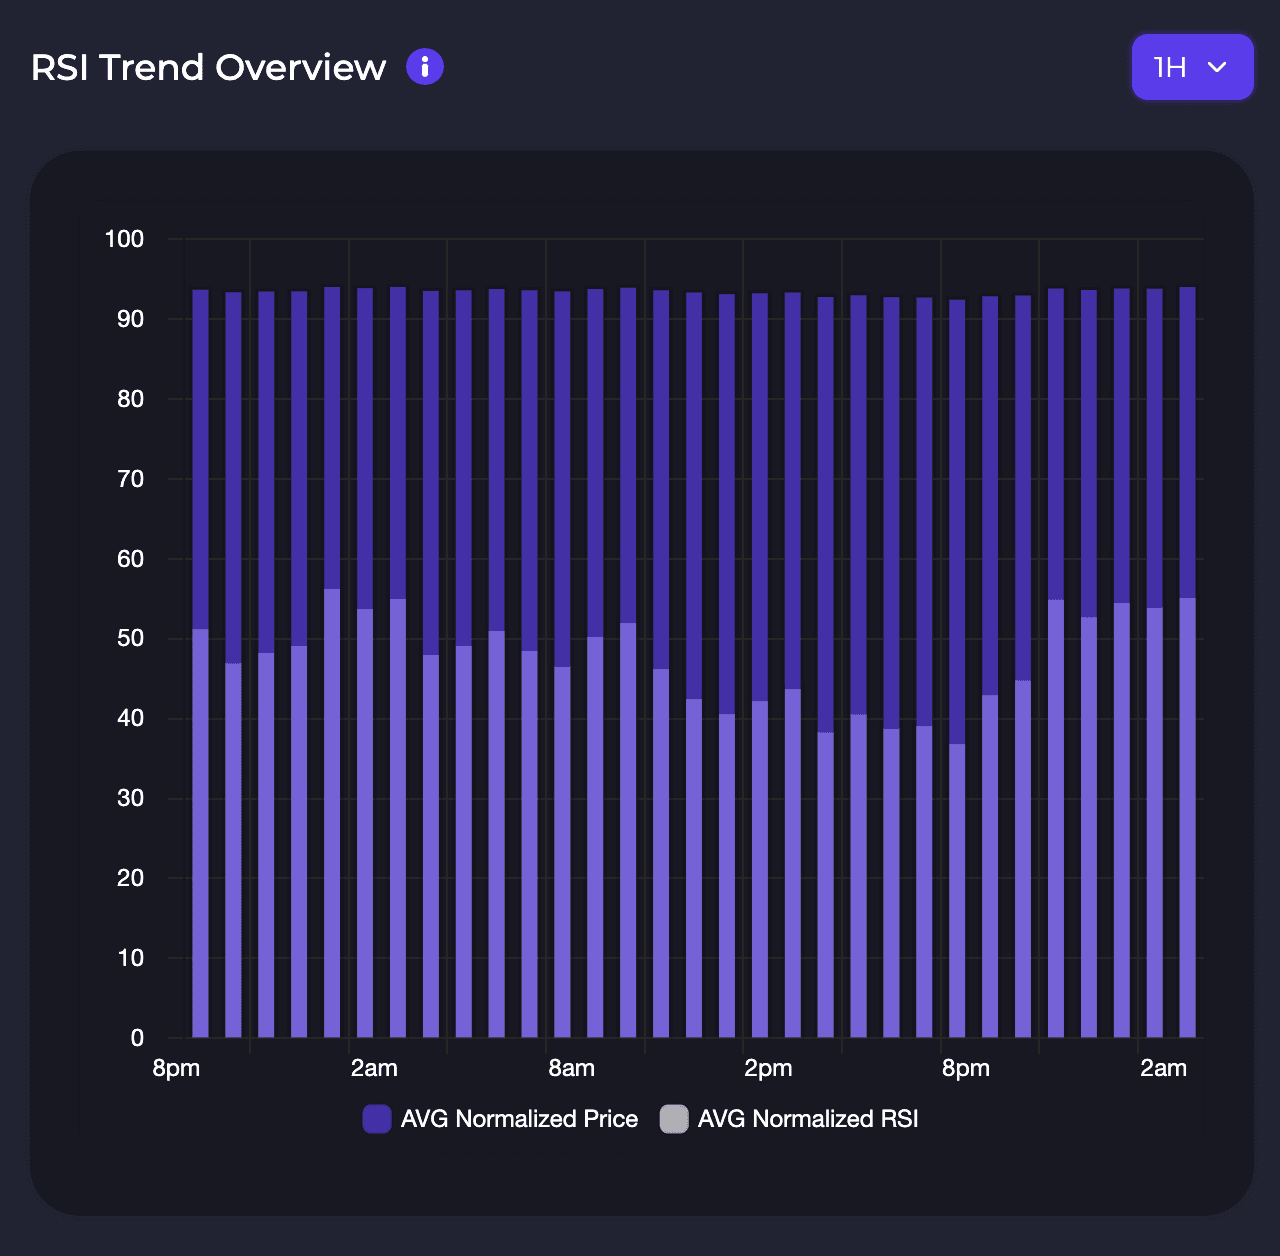
RSI Trend Overview
The normalized market RSI value compared to the normalized market price value. This can help you anticipate the general market trend.
RSI Watchlist
Coins you have on your watchlist that are currently in Market Mapper's top 50 RSI related coins.
These top 50 have the most extreme RSI value in the market, whether highest or lowest.

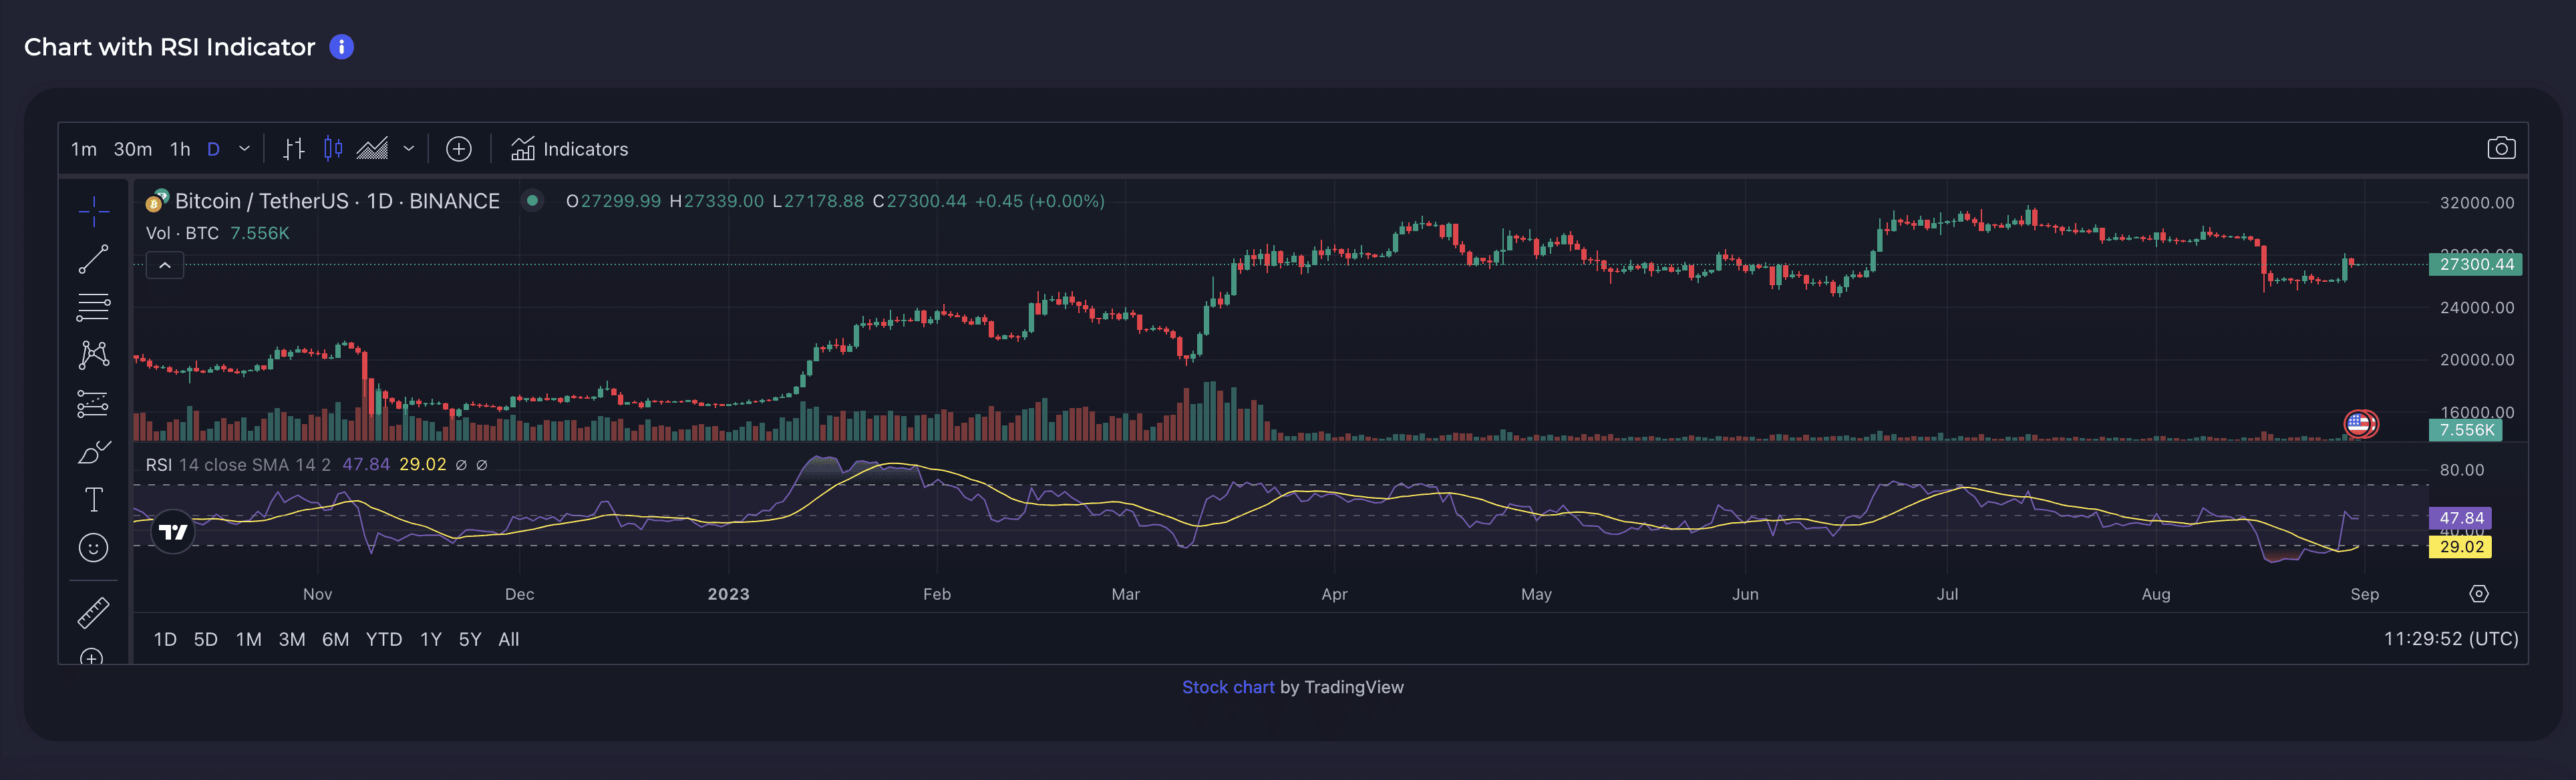
Chart with RSI Indicator
Easily access TradingView chart while accessing the dashboard for convenience.