Once you've signed up on our website, you will have instant access to use our indicators on the platform. In order to use the indicators, navigate to the left-hand side of the dashboard. You will see specifically labeled icons, each indicating different features and indicators.
It is highly recommended to turn on browser notifications for indicator alerts. You may do so by clicking Allow notifications in the popup at the top of the page.
Opening a trade
Market Mapper is yet to be connected to exchanges directly. Its current purpose is being an extra assurance for you as the trader to rely upon. We do not guarantee profits, we only provide the technical analysis of the current trends in the crypto markets for thousands of tokens. Technical indicators are to help you in making the most sound decision possible by you.
To make a trade, do what you normally do on your preferred exchange. When you believe you can make a position, quickly refer to Market Mapper to see whether the tide looks to be in your favor, and then make a trade when you feel like it!
Layout of Homepage
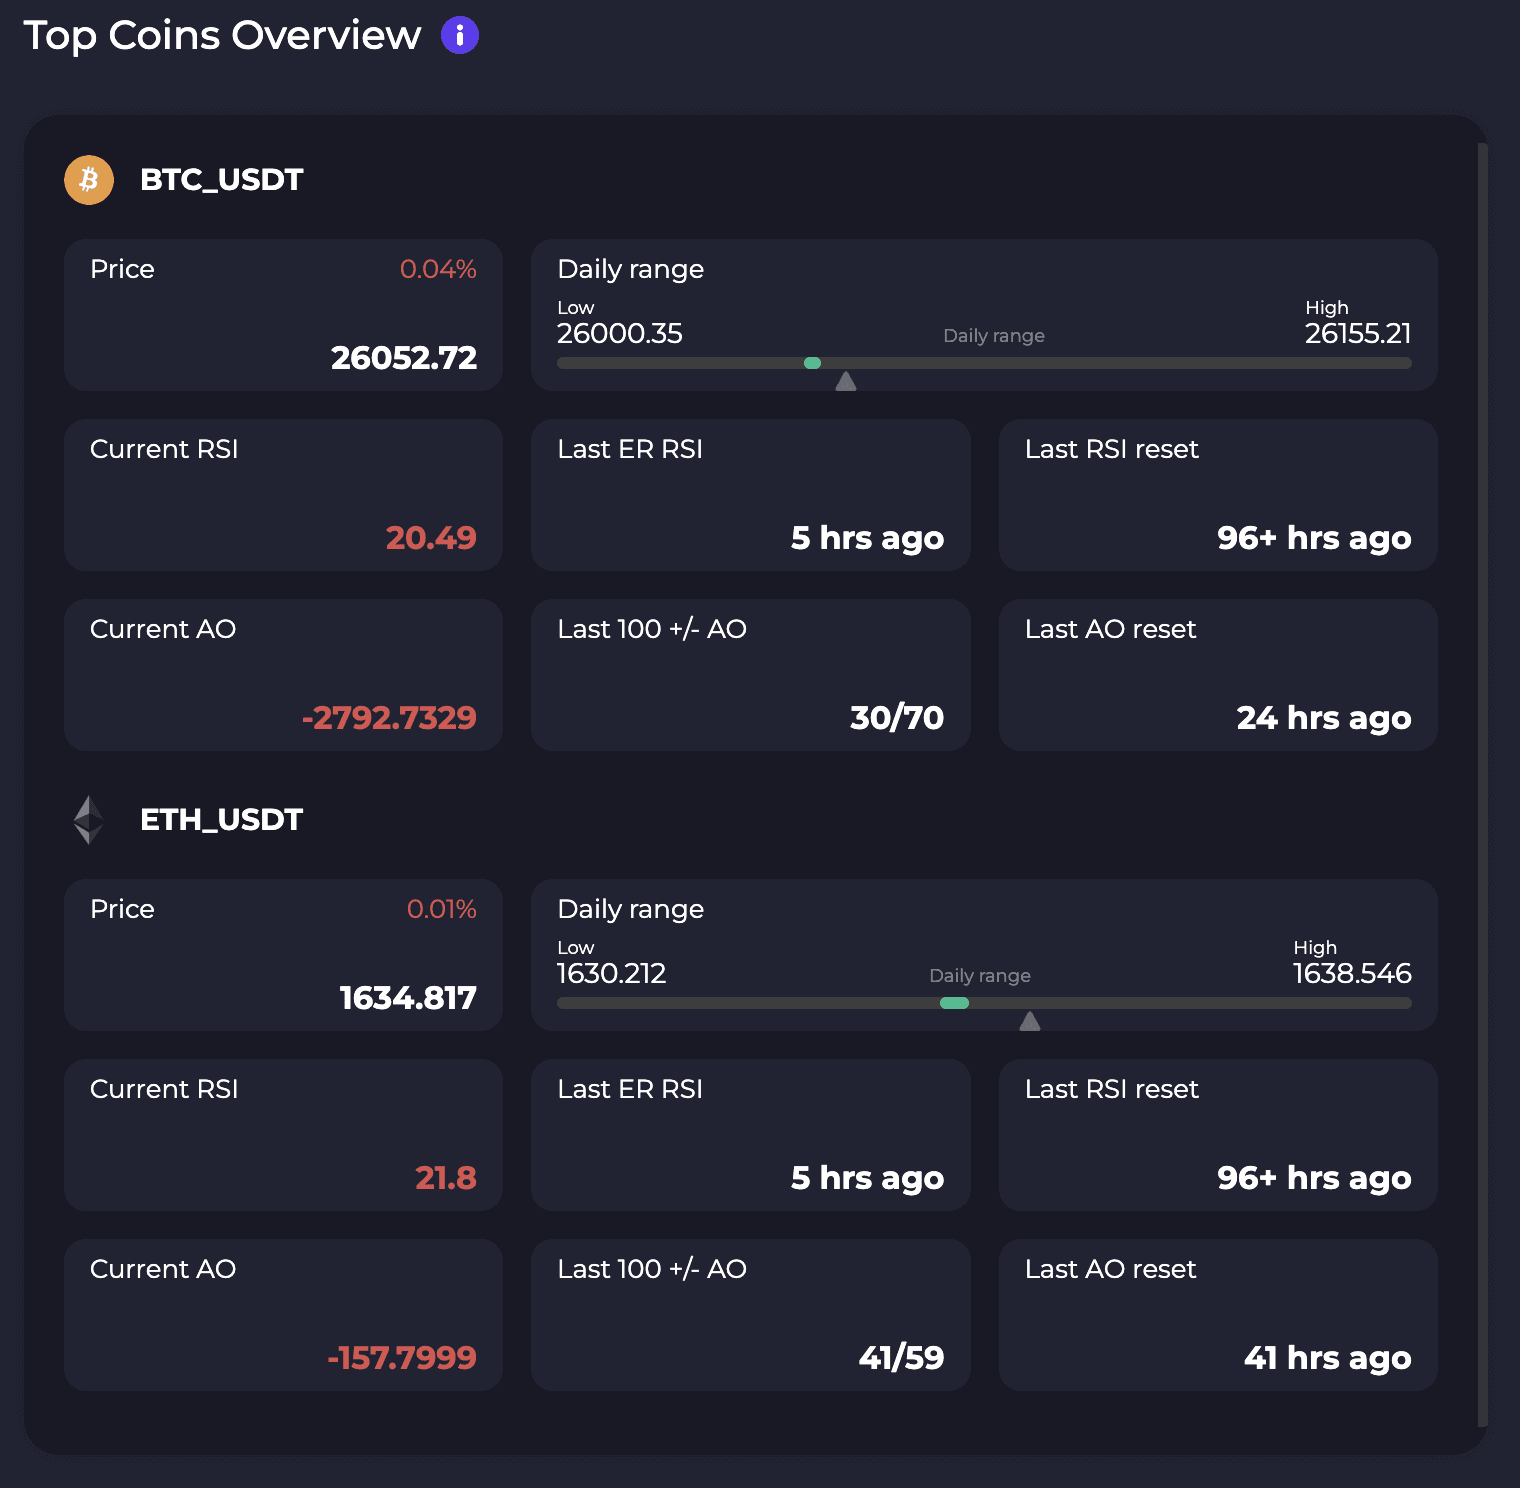
Top Coins Overview:
Some coins like BTC & ETH can strongly sway the market and are pointed out to your attention.
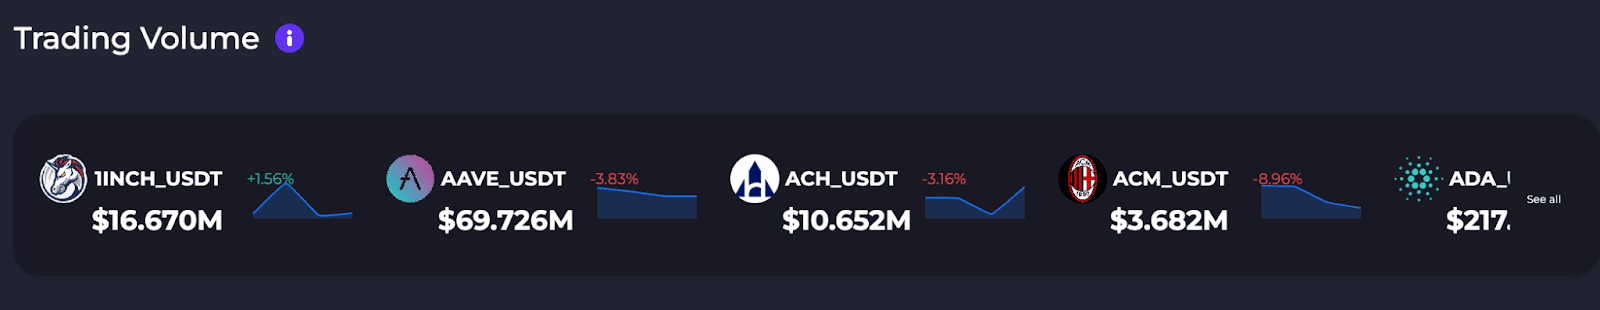
Trading Volume:
The total quantity of shares or contracts traded for a specified security. It is measured on any type of security traded during a trading day.
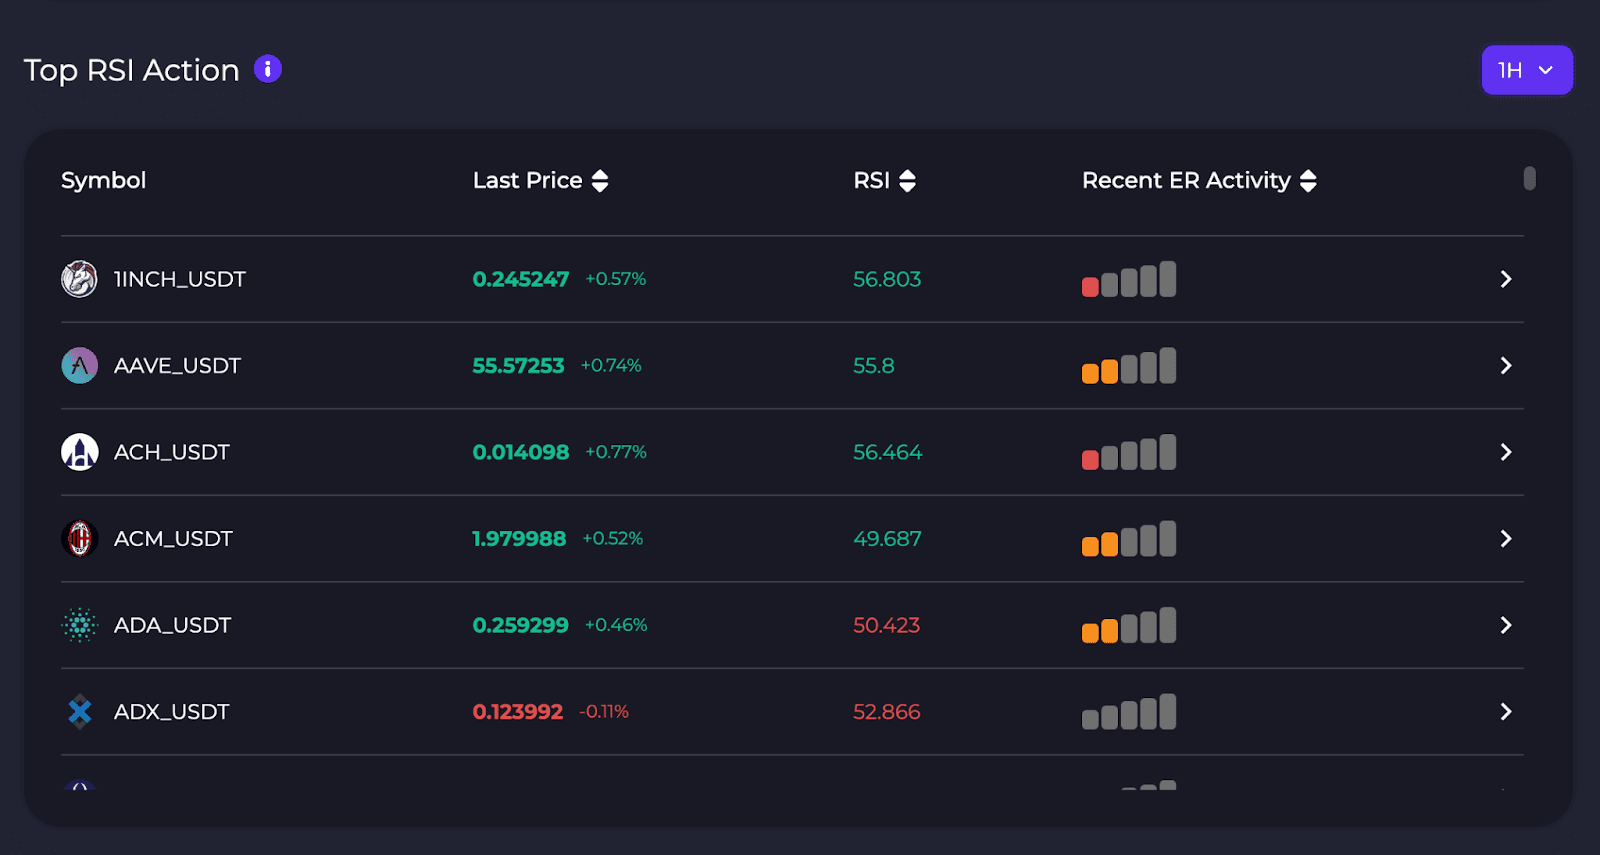
Top RSI Action Overview:
Some coins like BTC & ETH can strongly sway the market and are pointed out to your attention.
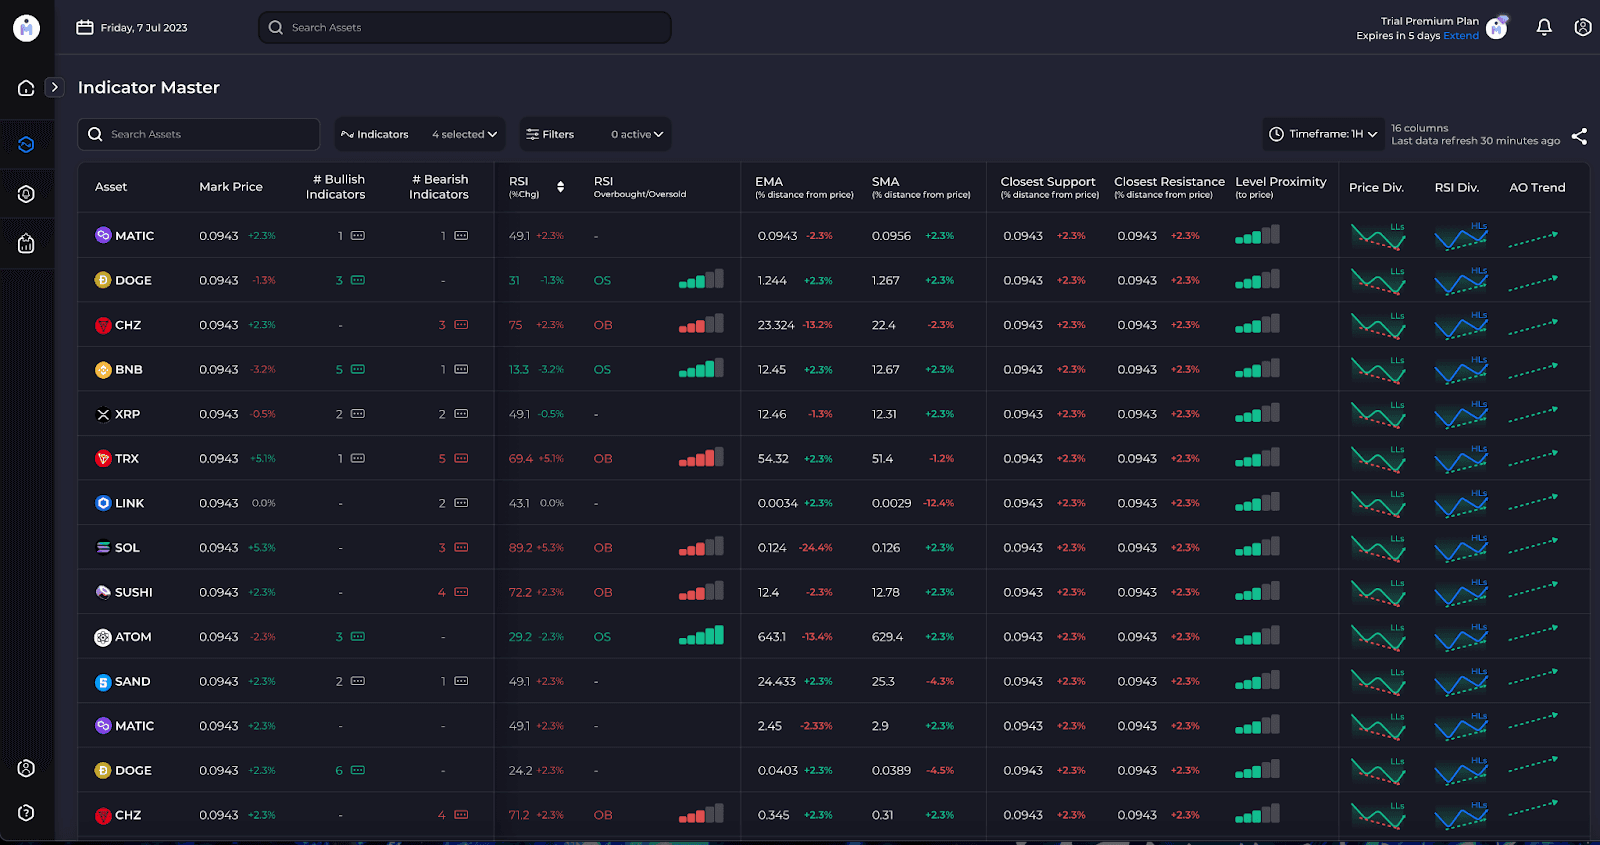
The Indicator Master dashboard:
The indicator Master dashboard will be your primary source of technical analysis. You will be able to sort the table to get best/worst performers on different technical indicator insights. Read more here.
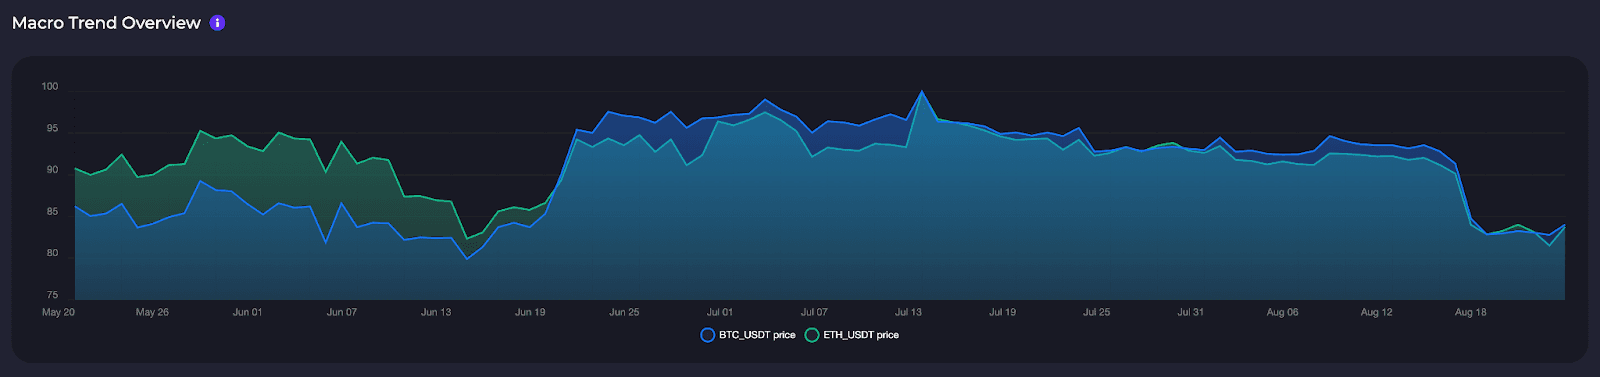
Macro Trend Overview:
Get the big picture of BTC to USDT and ETH to USDT trends.
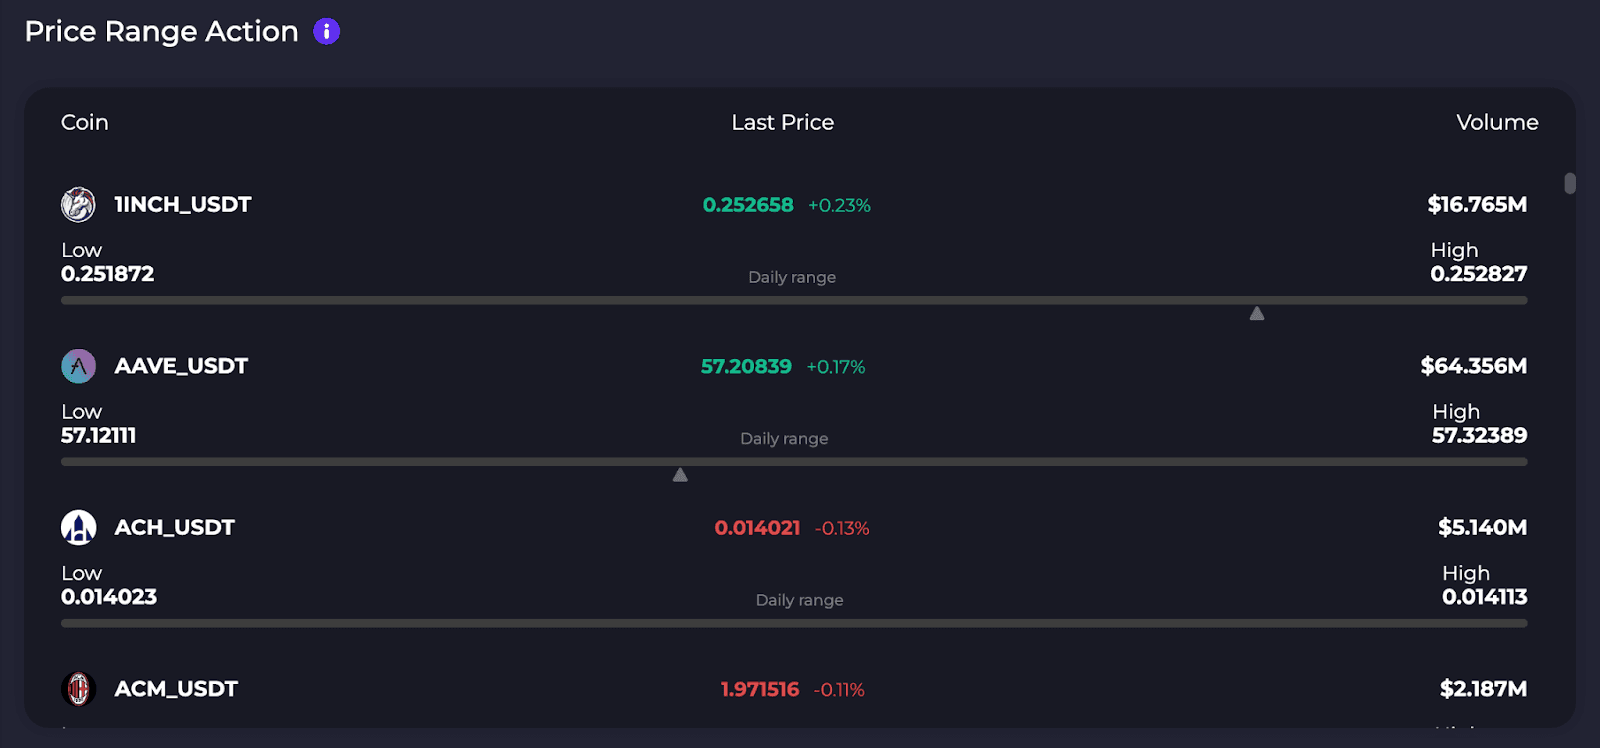
Price Range Action:
Widest/narrowest price range action in the past 24h. This table showcases the daily price range to point out which coins have the largest/smallest price movement. The coins can be filtered to show from the widest/narrowest price ranges for your convenience.
Layout of Coin Dashboard
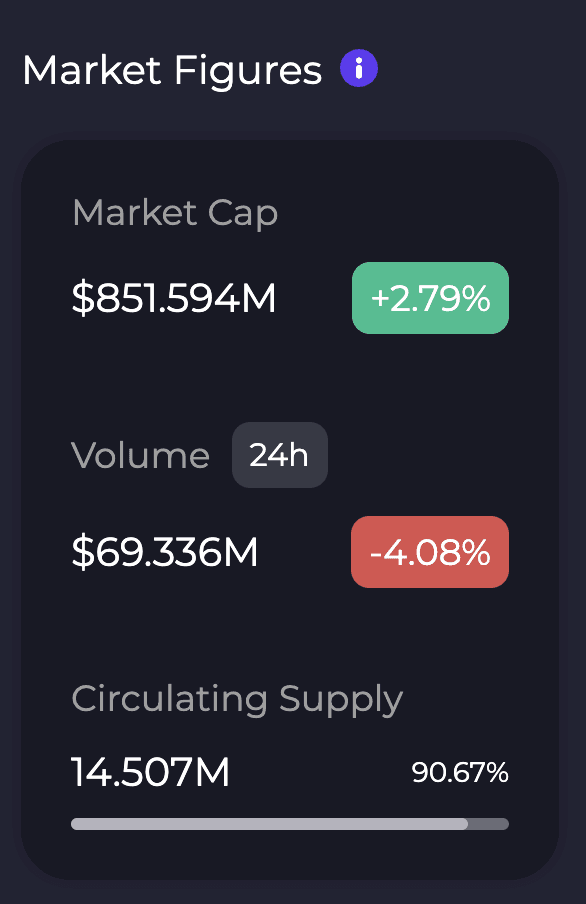
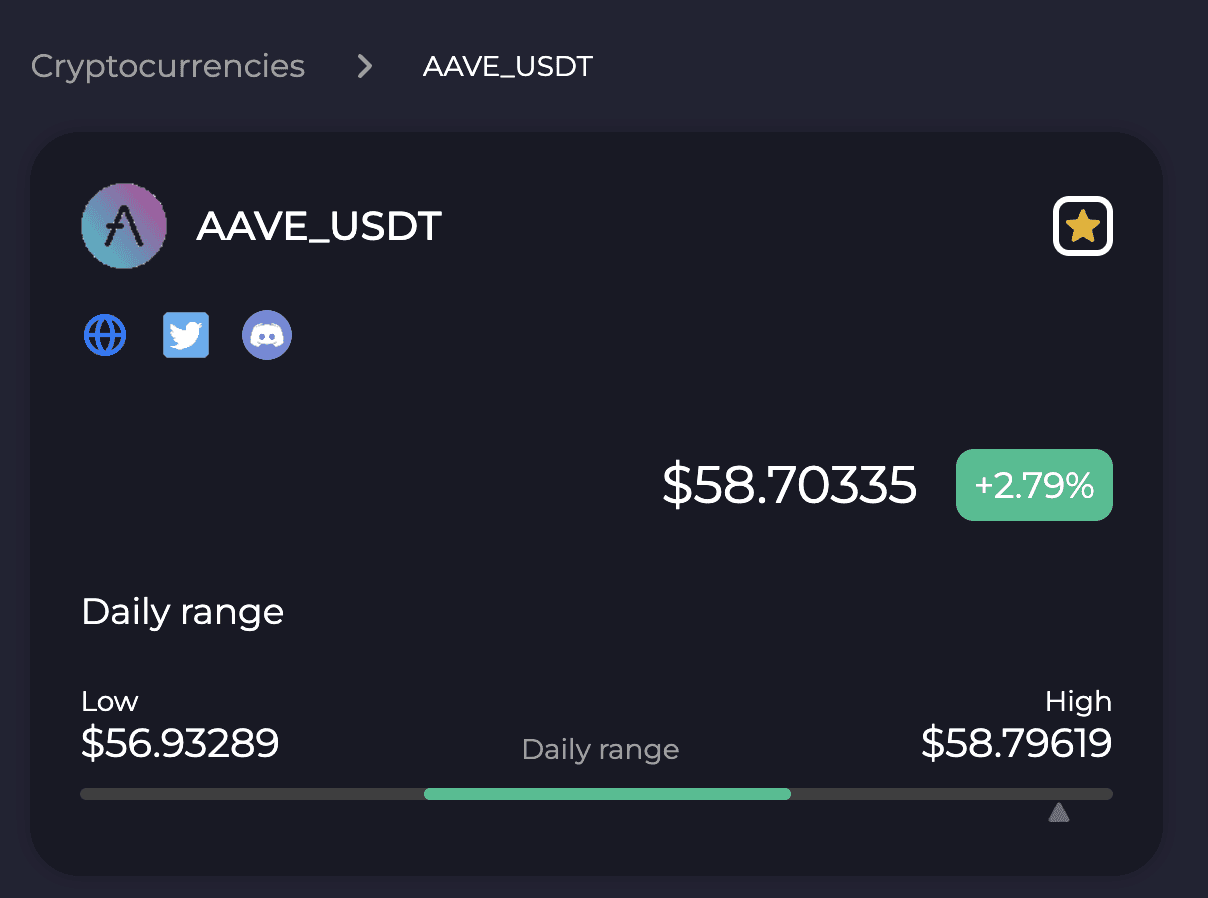
Market Figures:
Market cap is the total market value of a cryptocurrency circulating supply.
Volume is the total value of the cryptocurrency traded in the last 24 hours.
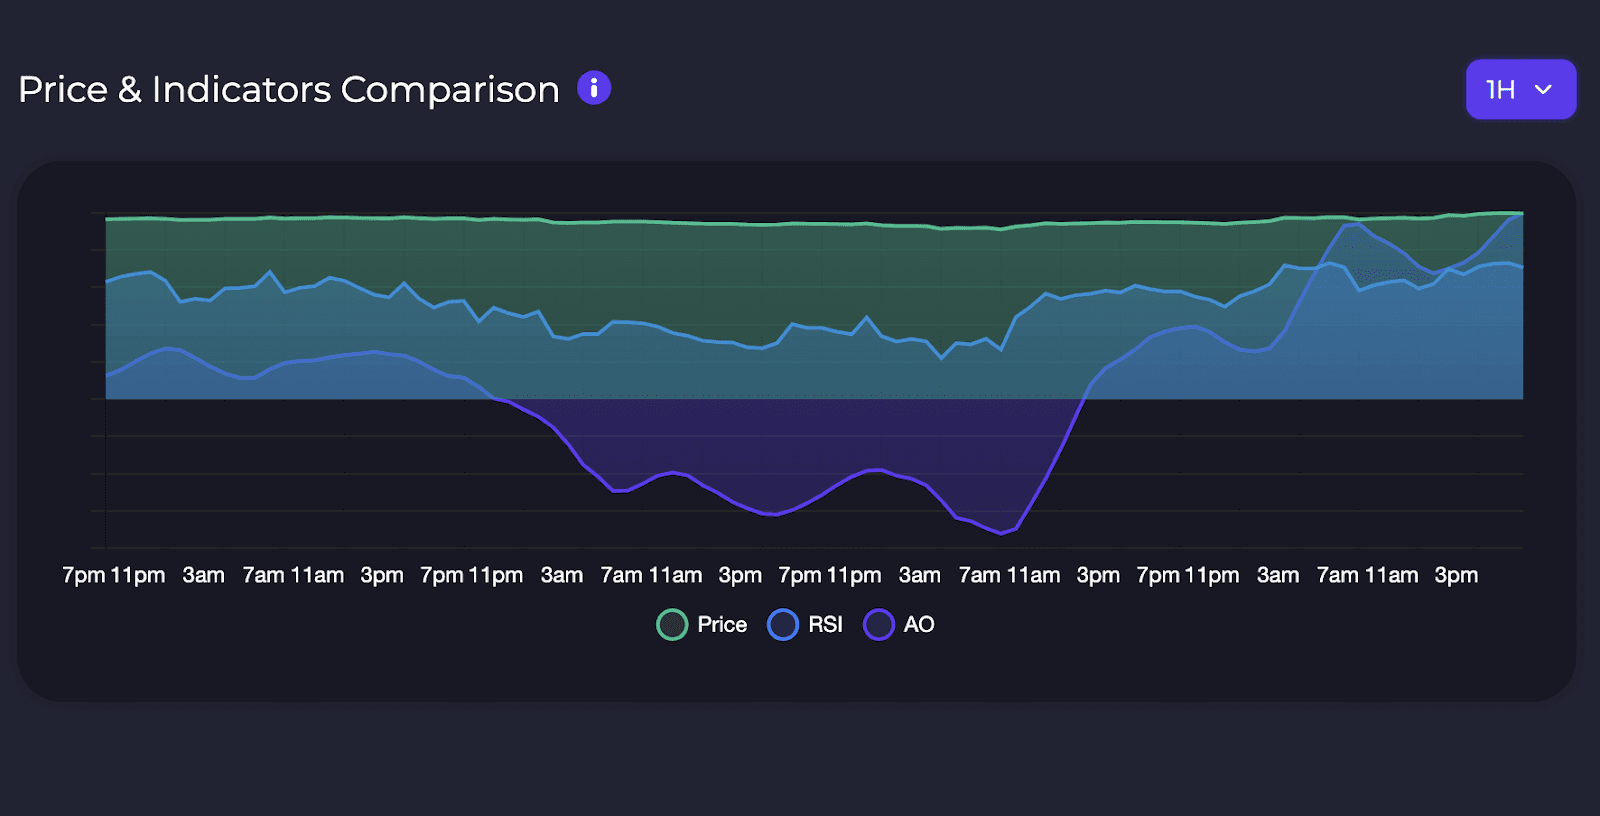
Price and Indicators Comparison:
Daily range:
Here you will see a range ranging from low to high price with the daily range been highlighted.
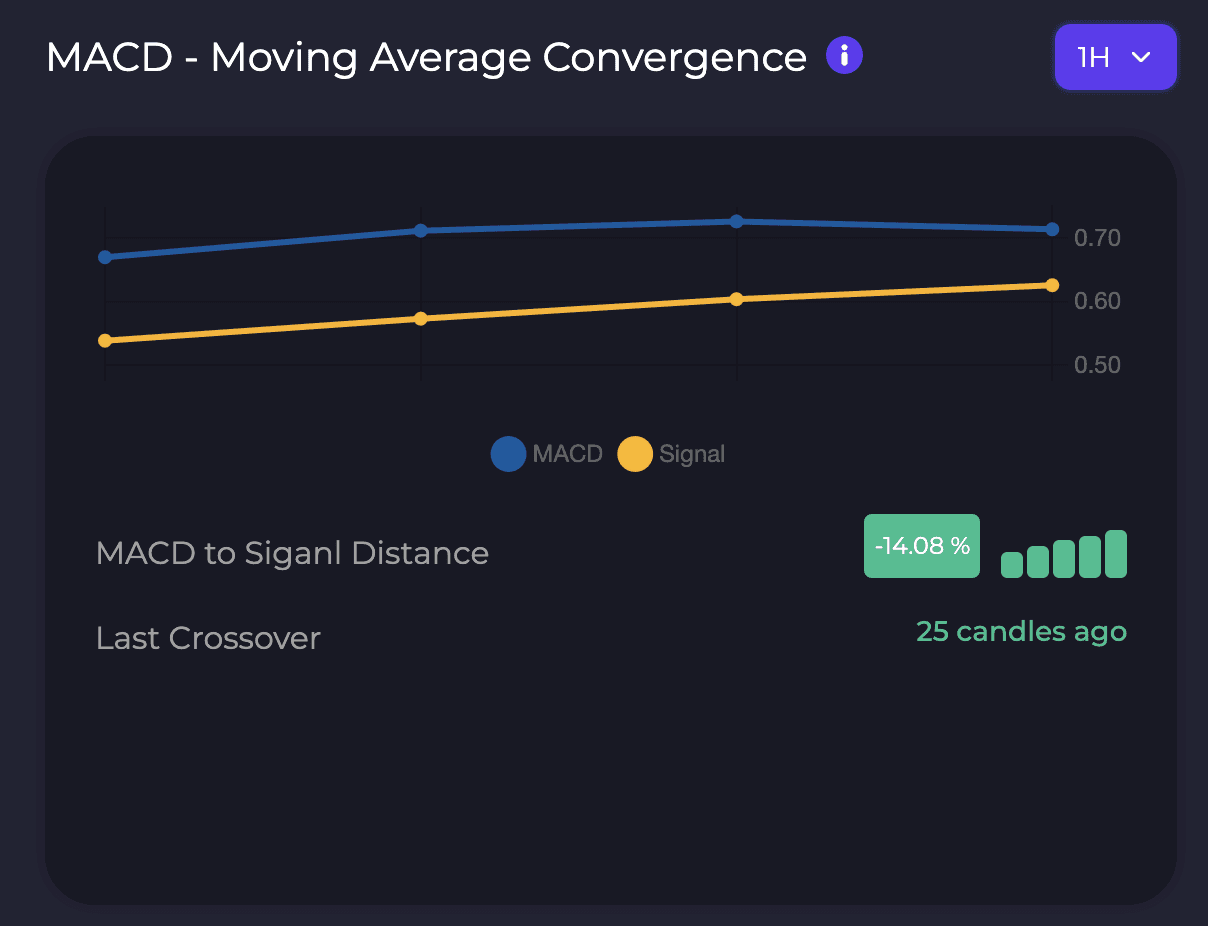
Moving Average Convergence:
The difference between two exponentially smoothed moving averages of closing prices (usually the last 12 and 26 days or weeks). An overbought condition is present when the lines are too far above the zero line. An oversold condition is present when the lines are too far below the zero line.
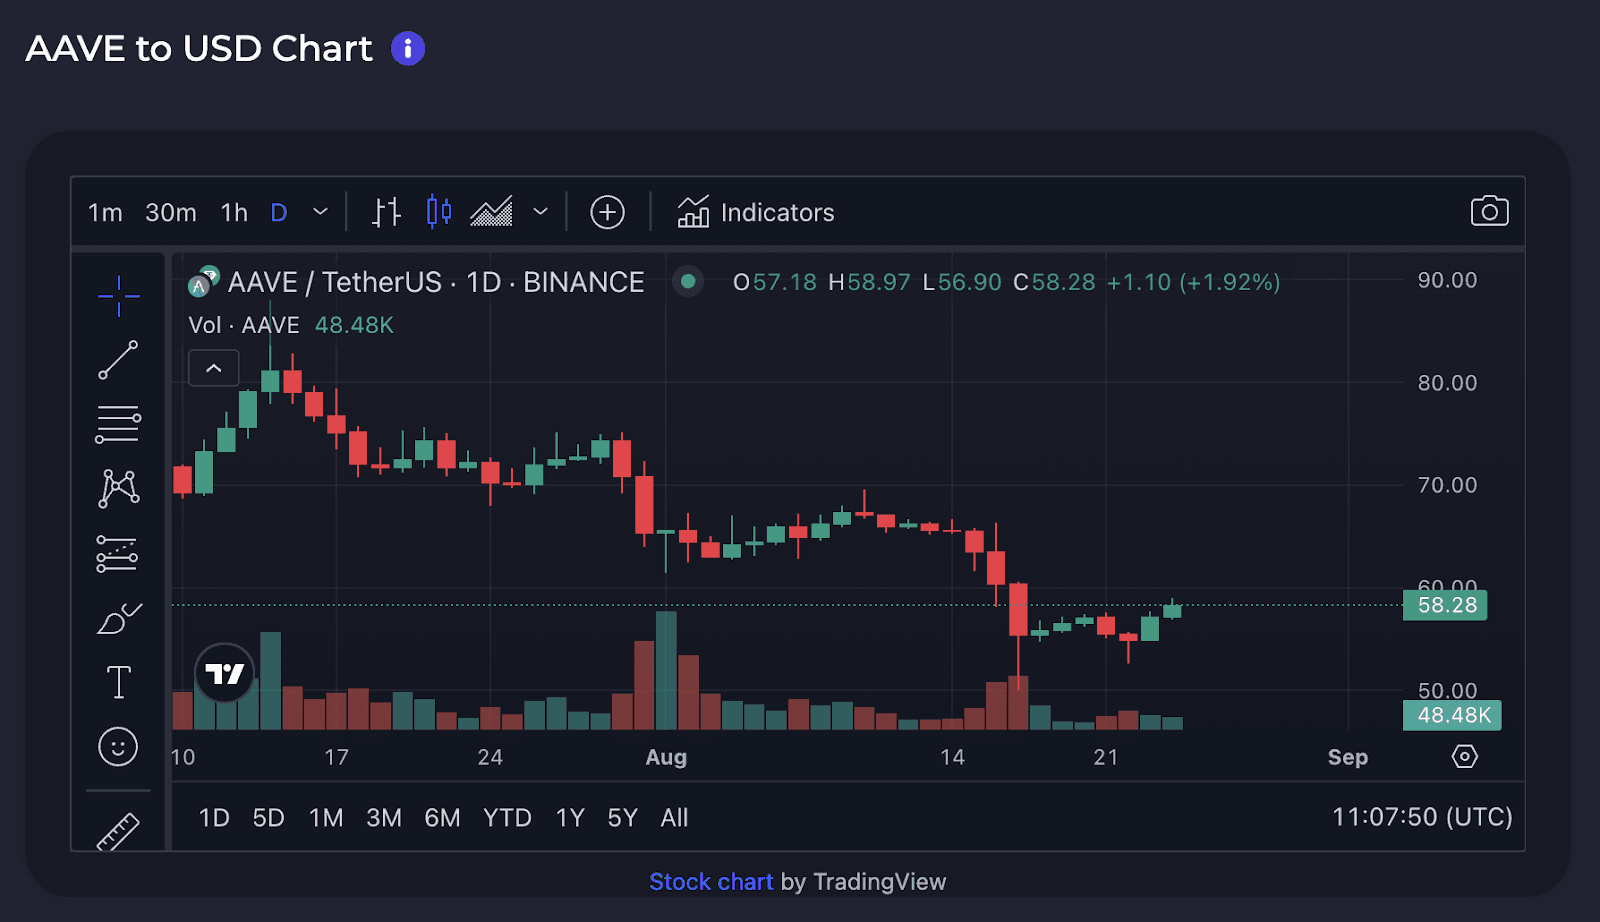
Chosen cryptocurrency to USD Chart:
We use a TradingView widget to give you the ability to have quick glances at the charts.