
The Indicator Master dashboard lets you view all the technical indicators, side by side. This allows you to get a quick technical overview of the whole market trend of thousands of cryptocurrencies. You have various abilities for customization of the table to suit your needs and indicator preferences by using filters, etc.
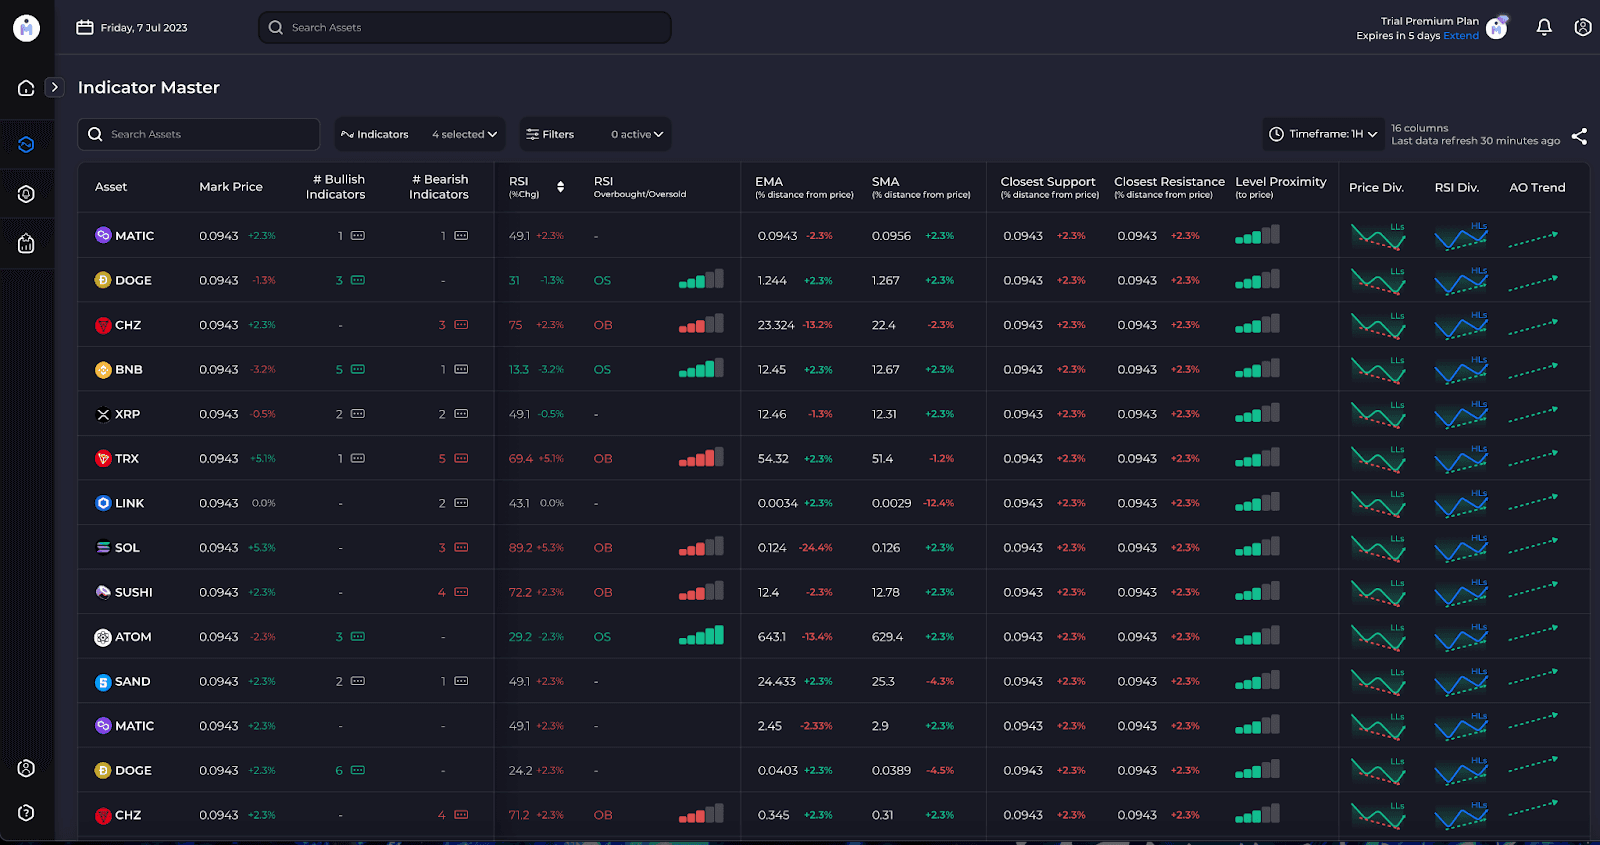
General Usage
The Indicator Master dashboard is designed to be easy to navigate and use. Each column, apart from the left most column, represents a technical indicator. You can easily maneuver the table like below.
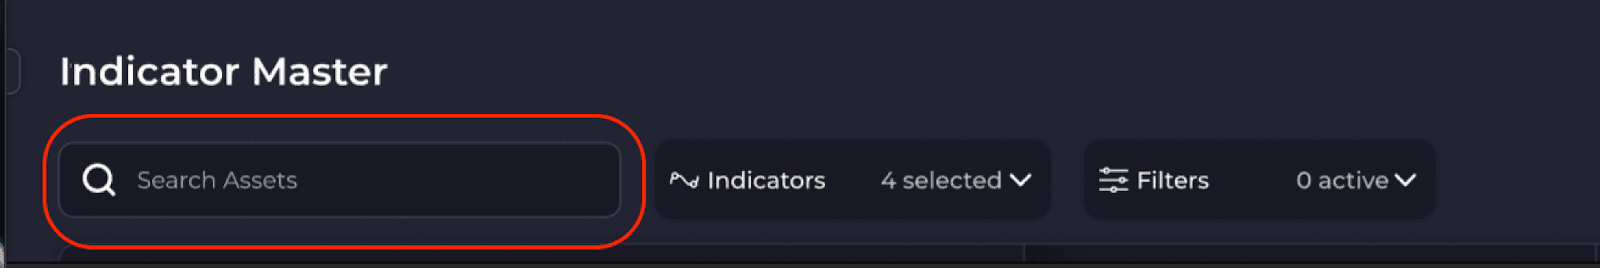
Search
Search various cryptocurrencies which seamlessly creates a filtered table of tokens corresponding to your search.
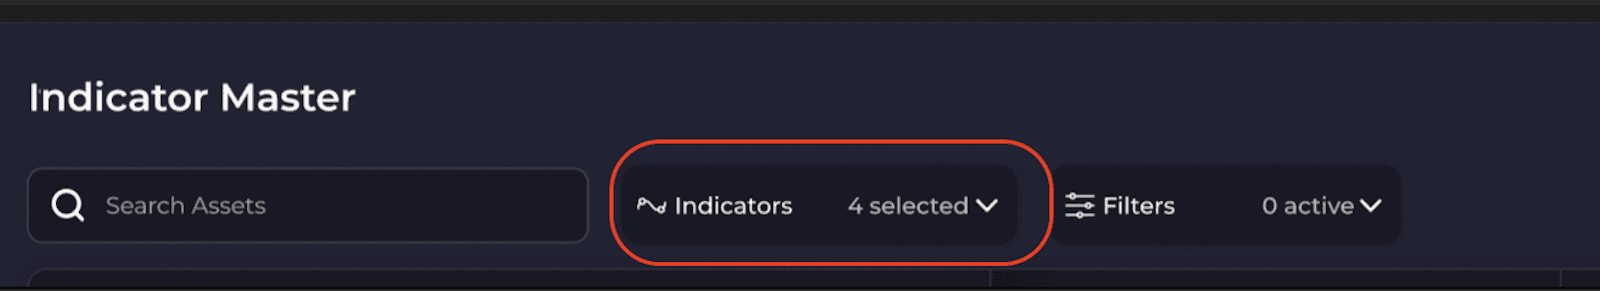
Indicator Selection
You may select how many indicators and which ones you wish to view on the screen at any given time. As a trader, you will have your own preferences on what indicators are the best for your trading strategy.
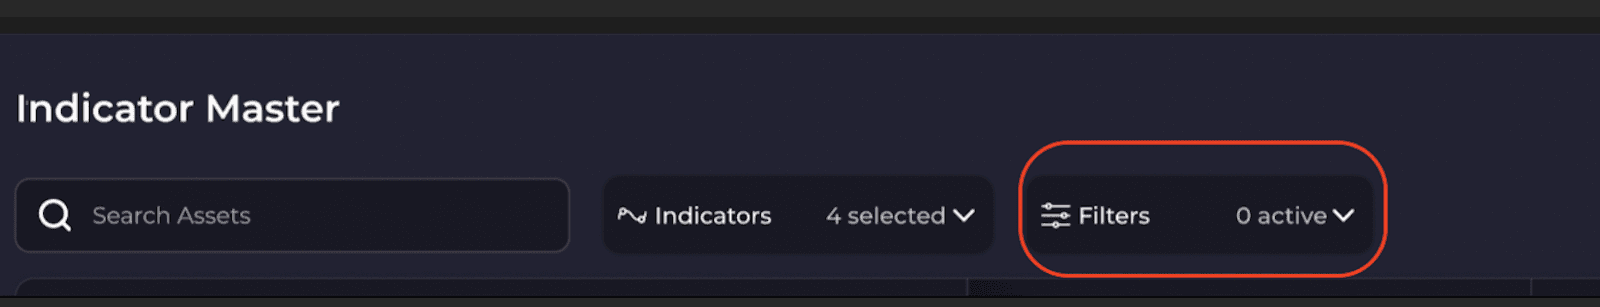
Filters
Filter cryptocurrencies based on different categories like exchange, market cap, and so forth.
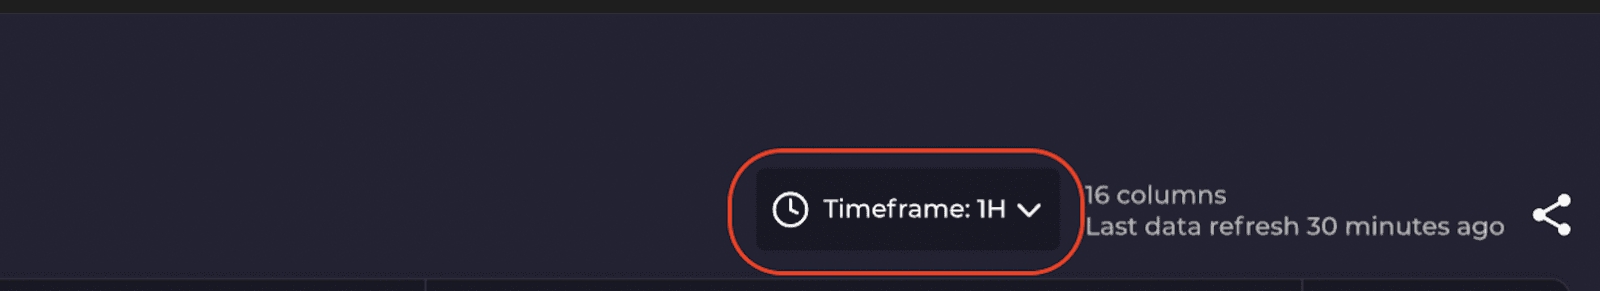
Timeframe
Adjust the time frame from 1H, 4H, 1D, 1W.
Dashboard Elements
Mark Price
When you see +x%, it indicates the unrealized profit of a trade. While -x% indicates the unrealized loss of a trade.
No. of Bullish Indicators
You will notice some numbers are grey (1, 2) or green (3, 4, 5, 6) in colour. This is to give emphasis on when there are more indicators that are bullish for a token.
No. of Bearish Indicators
You will notice some numbers are grey (1, 2) or red (3, 4, 5, 6) in colour. This is to give emphasis on when there are more indicators that are bearish for a token.
SMA (% Distance from price)
The average closing price of a given security over a specific number of days in percentage.
EMA (% Distance from price)
EMA gives more weight to recent prices.
Doji Type
You have the Gravestone represented as below which indicates more bearishness.
You have the Dragonfly represented as below which indicates more bullishness.
You have the Long-legged represented as below which indicates indecision on the part of market participants.