Hello all, and welcome to the enigmatic world of candlestick patterns! In this post, we embark on a journey to unravel the secrets of the Doji candlestick—an ancient symbol that holds profound significance in the world of trading. Prepare to be captivated by the mystique of Doji and discover how day traders utilize its different types to navigate the ever-changing tides of the market. So light your candles of curiosity, and let's decode the magic of Doji!
Chapter 1: The Doji Candlestick Unveiled
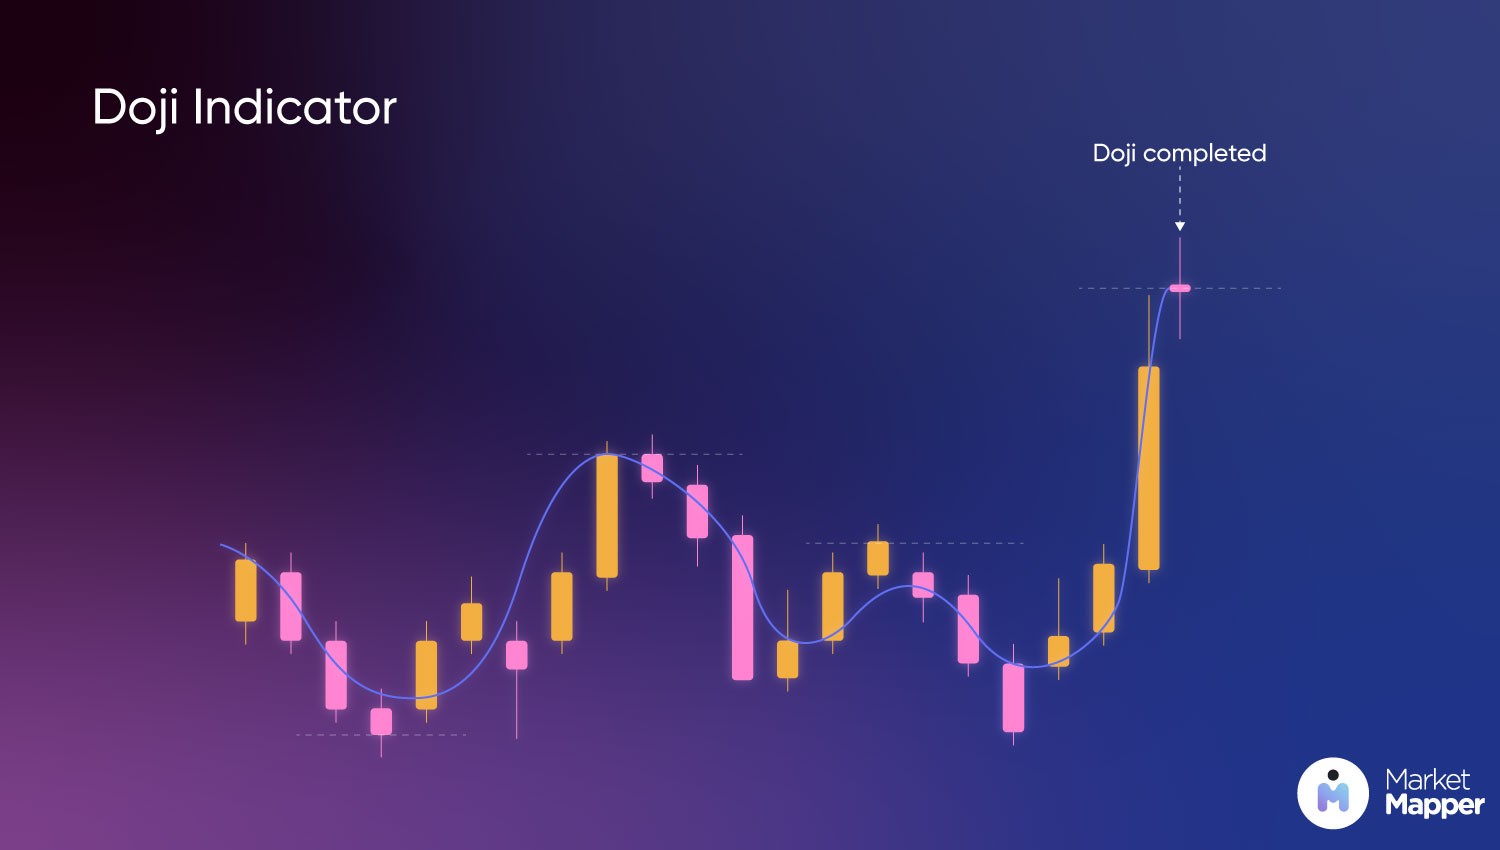
Like a flickering flame in the darkness, the Doji candlestick is a unique and intriguing phenomenon in the realm of technical analysis. At its core, a Doji represents a period of market indecision, where the opening and closing prices are virtually the same, forming a cross-like shape. This indecision occurs when the market's forces—buyers and sellers—are at a standstill, leading to a potential trend reversal or a continuation of the current trend. Spotting a Doji requires observing the length of its body, its upper and lower shadows, and the context in which it appears on the price chart. When the open and close prices are nearly identical, and the Doji appears after a strong uptrend or downtrend, it becomes a compelling signal for traders to pay attention to.
Chapter 2: The Dance of Different Doji Types
Much like stars in the night sky, Doji comes in various shapes and sizes, each conveying distinct messages to traders. Let's explore the different types of Doji and their unique characteristics:
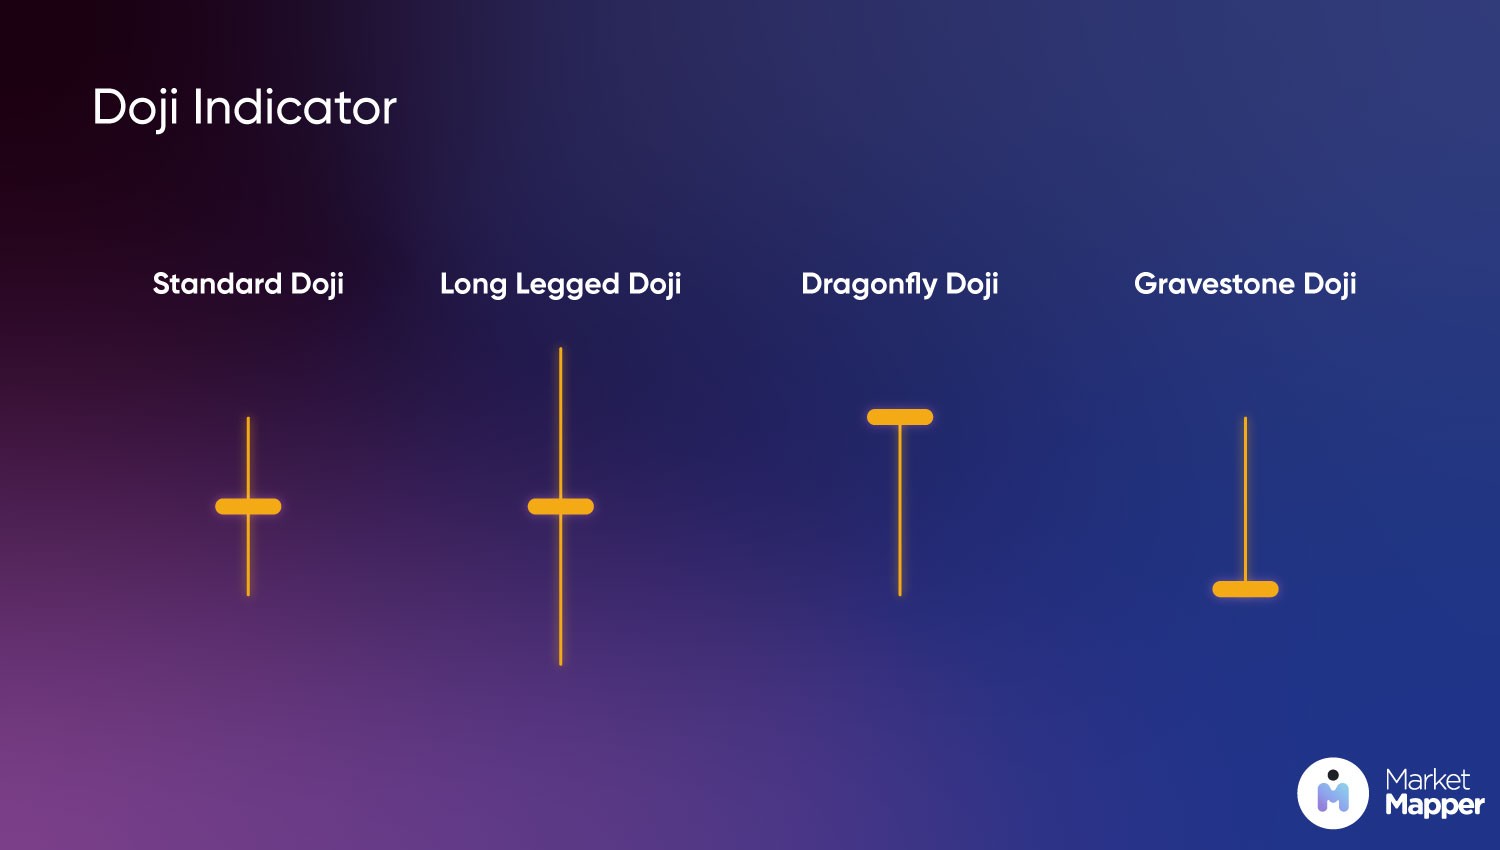
1. Standard Doji: The classic Doji pattern with a small body and no or very short shadows. It signifies uncertainty in the market.
2. Long-Legged Doji: This Doji exhibits long upper and lower shadows, indicating intense market indecision and potential trend reversal.
3. Dragonfly Doji: This Doji has a long lower shadow and no upper shadow, suggesting a bullish trend reversal after a downtrend.
4. Gravestone Doji: The Gravestone Doji boasts a long upper shadow and no lower shadow, signaling a bearish trend reversal after an uptrend.
Each Doji type has its unique implications on market sentiment, and day traders can use them as potential signals for entry or exit points.
Chapter 3: Reading the Message of Doji
Every candlestick tells a story, and Doji is no exception. In this chapter, we'll delve into the fascinating narratives that different Doji types convey:
1. Bullish Doji: This pattern appears after a downtrend, and it signals a potential reversal in favor of the bulls. It suggests that buyers are gaining control, and the price may rise in the near future.
2. Bearish Doji: On the contrary, the Bearish Doji emerges after an uptrend and indicates a possible reversal in favor of the bears. It implies that sellers may take control, leading to a potential price decline.
3. Indecision Doji: The Indecision Doji signifies uncertainty in the market and is often found in periods of consolidation or when major news is pending. It implies that traders are unsure about the next direction, and it may precede a breakout or continuation of the current trend.
By identifying the type of Doji and its context in the price chart, day traders can gain valuable insights into potential market trends and reversals.
Chapter 4: The Doji Strategies of Day Traders
With the knowledge of different Doji types and their meanings, day traders can craft their strategies to capitalize on potential opportunities:
1. Confirmation with Other Indicators: Day traders can use Doji patterns in conjunction with other technical indicators, such as moving averages, RSI, or trendlines, to validate potential trading signals. For instance, if a Bullish Doji appears near a strong support level or a trendline, it reinforces the likelihood of a trend reversal and the same goes for a Bearish Doji that appears before a strong resistance level.
2. Risk Management: When incorporating Doji patterns into their trading plan, day traders should set appropriate stop-loss and take-profit levels. This helps protect their capital and secure profits in case the market moves against their trade.
3. Contextual Analysis: The effectiveness of Doji signals depends on their context within the larger market structure. Day traders should analyze the overall market trend, volume, and other supporting factors to ensure a more comprehensive trading approach.
4. Doji Breakout Strategy:
The Doji Breakout strategy involves waiting for a Doji pattern to form within a consolidation phase or a tight trading range. Once the Doji appears, traders anticipate a potential breakout in the direction of the next strong trend. They set buy or sell orders just above the high or low of the Doji, respectively, to enter the trade once the price breaks out of the consolidation range. Traders may also use additional technical indicators, such as Bollinger Bands or Average True Range (ATR), to confirm the potential breakout.
5. Doji Reversal Pattern Confirmation:
Day traders can use Doji candlesticks to confirm other reversal patterns. For instance, if a Doji appears after a long bearish candlestick, it can validate a potential bullish reversal. Similarly, a Doji after a long bullish candlestick may confirm a possible bearish reversal. Combining Doji with other candlestick reversal patterns enhances the probability of successful trades.
6. Doji Gap Strategy:
The Doji Gap strategy involves identifying Doji candlesticks that appear in the context of a price gap on the chart. A price gap occurs when there is a significant difference between the previous day's closing price and the current day's opening price. A Doji forming within this gap signals a potential shift in market sentiment. Traders may take this as an opportunity to enter a trade in the direction of the gap, anticipating a potential continuation or reversal of the trend.
7. Doji as a Confirmation of Support and Resistance Levels:
Doji candlesticks can also serve as confirmations of support and resistance levels on the price chart. When a Doji forms near a strong support level, it may suggest that buying pressure is increasing, potentially leading to a bounce off of the support level. Conversely, a Doji near a robust resistance level may indicate growing selling pressure, hinting at a potential price reversal. Combining Doji with support and resistance analysis provides a robust approach to identify potential entry or exit points.
Conclusion: Embracing the Magic of Doji
Congratulations, brave day traders, on unlocking the magic of Doji candlesticks! By understanding the different types of Doji and interpreting their messages, you have gained a valuable skill to navigate the market's enigmatic waters. Remember, Doji patterns serve as beacons of market indecision, offering potential signals for trend reversals and price movements. Combine this knowledge with other technical indicators, adhere to risk management principles, and let the magic of Doji guide you towards profitable trades.
Disclaimer: This blog post is for informational purposes only and should not be considered financial advice. Always conduct thorough research and consult with professionals before making any investment decisions.
So there you have it—a comprehensive post on the mystique of Doji candlesticks and how day traders can use them to their advantage. Embrace the magic of Doji, and may your trading journey be illuminated with success and prosperity! Happy trading!